Visualizzazione post con etichetta NSX. Mostra tutti i post

domenica 1 marzo 2026

[SSP 5.1.0] vDefend SSP Backup Failures: Stuck at 60%

Issue


If you manage a VMware vDefend Security Services Platform (SSP) environment, you know how critical automated backups are. Recently, I ran into a frustrating issue where scheduled backups started failing mysteriously. What initially seemed like a simple user and misconfigured settings issue, “network timeout” turned out to be a bizarre problem involving lost encryption keys and crashing containers.
Looking on the SSP UI at the System > Backup and Restore dashboard, I noticed a long list of failed backup jobs. Hovering over the failure status yielded a very generic message: "operation timed out, please contact administrator".
I tried manually forcing the backup, but it seems to stuck at 60% and then time out after a while.
The generic timeout error on the Backup and Restore dashboard


Solution


My first instinct was to check the SFTP credentials, re-type the password, SAVE and seemed fine.
Googling around, I found this interesting link "Backup and Restore goes into Failed State" which helped me in the final resolution.

Since the UI wasn't giving me enough technical details, it was time to drop into the CLI. I logged into the SSPI appliance via SSH as sysadmin to check what was happening at the Kubernetes pod level.

I ran a quick ...
kubectl get pods -n nsxi-platform | grep backup
... and immediately spotted the problem. The backup job pods weren't just timing out; they were actively crashing, throwing Error and OOMKilled statuses.
To understand why the pods were in this state ("OOMKilled", "Error"), I checked the logs of both pods....
k logs job-backup-4fv4k-5gq5s -n nsxi-platform
Scrolling through the container logs, I could see ... the system passed a malformed argument to the OpenSSL encryption command.
The log explicitly stated:
Error executing command: [openssl enc -aes-256-cbc -salt -in ... -out ... -k ******]. 
Error: fork/exec /usr/bin/bash: argument list too long.
Scrolling through the container logs, I could see the backup job actually doing its work: generating the .obj and .dump files from the Postgres database and config files.
However, the process abruptly halted right after the ...
<INFO> ... Started encrypting backup bundle
... message.


Conclusion

How did I fix it? I re-entered the password and retyped the passphrase to ensure the openssl process received a valid string, allowing the container to properly encrypt the dump files and upload them to the SFTP server.

The mystery was solved. The "timeout" in the UI was just a side effect. The real issue was that the missing encryption key caused the openssl command to fail spectacularly (resulting in an argument list too long OS error), which crashed the container pod.

It appeared the platform had somehow lost track of the encryption key. The configuration was stuck in a weird state where trying to "Reuse prior passphrase" wasn't working.

Now starting the backup in manual mode, it completes successfully.


That's it.

venerdì 8 agosto 2025

[NSX - KB406460 ] NSX_OPSAGENT on ESXi node

Issue


Today has been release the KB 406460 related "The memory usage of agent NSX_OPSAGENT on ESXi node <UUID> has reached <kb> kilobytes which is at or above the high threshold value of 80%"


Solution


As a temporary workaround to the issue as mentioned in option 1, which consist in to restart OpsAgent on the affected hosts; I wrote a short prowershell script to restart the agent on all hosts connected to vCenter Cluster.
Let's see it below:

##########
# 
# Run remote commands (Linux like) on esxi hosts to restart /etc/init.d/nsx-opsagent
#
# How it works:
# 	Connect to vCenter
# 	Get the list of ESXi hosts from the cluster
# 	Enable SSH on host
# 	Restart "/etc/init.d/nsx-opsagent" service on the host
# 	Disable SSH on host
#
# Requirement: Install-Module -Name Posh-SSH
#
# LM 22.05.2025
##
Import-Module -Name Posh-SSH

#Replace the parameter below with your values
$esxiUser = "root"
$esxiPassword = "<ESXi - PASSWORD>"
$vc = "<vCenter IP or FQDN>"
$vcUser = "administrator@vsphere.local"
$vcPassword = "<vCenter Password>"
$clusterName = "<Cluster Name>"

Connect-VIServer -Server $vc -User $vcUser -Password $vcPassword

$count=0
foreach ($esxiIP in (Get-Cluster -Name $clusterName | Get-VMHost)) {
  $count = $count + 1      
  Write-Host " ----------------------- $($esxiIP) ----------------------------------"
  # Enable SSH 
  Write-Host " Enabling SSH! " -ForegroundColor Green
  Get-VMHost -Name $esxiIP| Get-VMHostService | ?{"TSM-SSH" -eq $_.Key} | Start-VMHostService

  #SSH connection and service restart 
    $session = New-SSHSession -ComputerName $esxiIP -Credential (New-Object System.Management.Automation.PSCredential($esxiUser, (ConvertTo-SecureString $esxiPassword -AsPlainText -Force)))  -Force
    if ($session.Connected) {
        $command = "/etc/init.d/nsx-opsagent restart"
        $result = Invoke-SSHCommand -SessionId $session.SessionId -Command $command 
    
        if ($result.ExitStatus -eq 0) {
            Write-Host "Service restarted! on Host ->"$esxiIP -ForegroundColor Green
        } else {
            Write-Host "Error on host $($esxiIP): $($result.Error)" -ForegroundColor Red
        }
    
        Remove-SSHSession -SessionId $session.SessionId | Out-Null
    } else {
        Write-Host "SSH Connection failed! on Host ->"$esxiIP -ForegroundColor Red
    }

  sleep 1
  # Disable SSH
  Get-VMHost -Name $esxiIP| Get-VMHostService | ?{"TSM-SSH" -eq $_.Key} | Stop-VMHostService -Confirm:$false

  Write-Host " ----------------------------------------------------------------------------"
  Write-Host
}

Disconnect-VIServer -Server $vc -Confirm:$false


That's it.

lunedì 17 febbraio 2025

[NSX - Search for Objects] Quick TIP

Issue


Why if I do a search in the NSX "search bar" with the admin user, I get results and if I do the same search with another user (who identifies himself via vIDM, which has the same roles and permissions as the admin user), I get more information?? Both are "Enterprise Admin".
See pictures below, search with admin user ...
... search with another "Enterprise Admin" user.


Solution


When NSX is first installed, it does not set the "User Interface Mode Toggle" by default in System > Settings > General Settings > User Interface ...
When searching this leads to an incomplete results.
Changing to Policy Mode ...
... repeating the search with the Admin user .... now we have the complete result ...
Further information regarding the "Search for Objects" can be found at the following link.

That's it.

mercoledì 15 gennaio 2025

[NSX] Export Segment list into Excel

Issue


Starting from a post I wrote some time ago; about creating Session Cookies on Powershell for authentication in NSX, [NSX] - API Authentication Using a Session Cookie on PowerShell.
I had to create a script to export the complete list of segments configured in NSX, with their Subnets/Gateways, Tier-1s, Tier-0s, IDs, Transport Zones.
Below few line of code to do that. The code is provided without warranty, use at your own risk.

Solution


The script looks like this:

###################################################################
# list_nsx_segments.ps1
#
# LM v. 0.8
#
# This script uses the "ImportExcel" library 
# https://www.powershellgallery.com/packages/ImportExcel/7.8.10
# If not present install: Install-Module ImportExcel
# 
# Input parameters: NSX_MANGER_FQDN
#		    NSX_Username
#		    NSX_Password
#

param(
    [string] $nsx_manager = '<NSX_MANAGER_FQDN>'
)

#Used to handle/skip certificates
add-type @"
using System.Net;
using System.Security.Cryptography.X509Certificates;
public class TrustAllCertsPolicy : ICertificatePolicy {
    public bool CheckValidationResult(
        ServicePoint srvPoint, X509Certificate certificate,
        WebRequest request, int certificateProblem) {
        return true;
    }
}
"@
$AllProtocols = [System.Net.SecurityProtocolType]'Ssl3,Tls,Tls11,Tls12'
[System.Net.ServicePointManager]::SecurityProtocol = $AllProtocols
[System.Net.ServicePointManager]::CertificatePolicy = New-Object TrustAllCertsPolicy

[System.Net.ServicePointManager]::ServerCertificateValidationCallback = {$true}

function createSession {
    $script:session = New-Object Microsoft.PowerShell.Commands.WebRequestSession
    $script:headers = @{}
    $script:nsx_uri = "https://" + $nsx_manager
    #$uri = $nsx_uri + "/api/session/create"
    $private:body = "j_username=$($nsx_user)&j_password=$($nsx_pass)"
    
    try {
        $response = invoke-webrequest -contentType "application/x-www-form-urlencoded" -WebSession $session -uri $($nsx_uri + "/api/session/create") -Method 'POST' -Body $body -usebasicparsing -Erroraction Stop
        $xsrftoken = $response.headers["X-XSRF-TOKEN"]
 
        #$response
        $script:loginSuccess = $true
        $script:headers.Add("X-XSRF-TOKEN", $xsrftoken)
        $script:headers.Add("Accept", "application/json")
        $script:headers.Add('Content-Type','"application/x-www-form-urlencoded')
    }
    catch {
        Write-Host "Failed" -ForegroundColor Red
        Write-Host "$($_.Exception)" -ForegroundColor Red
        write-host "Error Details:" $_.ErrorDetails.Message -ForegroundColor Magenta
        $script:loginSuccess = $false
    }
}

#If you want insert Credential on fly uncomment the three lines below here and comment the hardcoded credentials 
#$MyCredential = Get-Credential -Message "Insert $nsx_manager "
#$nsx_user = $MyCredential.UserName
#$nsx_pass = [Runtime.InteropServices.Marshal]::PtrToStringAuto([Runtime.InteropServices.Marshal]::SecureStringToBSTR($MyCredential.Password))

#Harcoded credentials; uncomment if you don't want to insert them with Get-Credential function
$nsx_user = 'admin'
$nsx_pass = 'VMware1!VMware1!'


#Create the cookie session 
createSession


$response_t0s = $null
$response_t1s = $null
$response_seg = $null
$response_tz = $null

#Query the Tier-0s
$response_t0s = Invoke-webrequest -WebSession $session -uri $($nsx_uri + "/policy/api/v1/infra/tier-0s") -Method 'GET' -Headers $headers -usebasicparsing -Erroraction Stop
if ($response_t0s.statuscode -eq '200') {
    #echo $response_t0s.Content #print Json format
    $keyValue_t0s= ConvertFrom-Json $response_t0s.Content | Select-Object -expand "results"
    $sheet_t0s = $keyValue_t0s | select @{Name='T0 Name';Expression={$_.display_name}}, 
                                        @{Name='ID';Expression={$_.id}}
} else {
    Write-Host
    Write-Host
    write-Host -ForegroundColor red " !!! Somenthing went wrong !!! "
    exit 9
}
#RAW data check
#$sheet_t0s | Sort-Object -Property "T0 Name" | Out-Gridview

#Query the Tier-1s
$response_t1s = Invoke-webrequest -WebSession $session -uri $($nsx_uri + "/policy/api/v1/infra/tier-1s") -Method 'GET' -Headers $headers -usebasicparsing -Erroraction Stop
if ($response_t1s.statuscode -eq '200') {
    #echo $response_t1s.Content #print Json format
    $keyValue_t1s= ConvertFrom-Json $response_t1s.Content | Select-Object -expand "results"
    $sheet_t1s = $keyValue_t1s | select @{Name='T1 Name';Expression={$_.display_name}}, 
                                        @{Name='ID';Expression={$_.id}}

}
#RAW data check
#$sheet_t1s | Sort-Object -Property "T1 Name" | Out-Gridview

#Query the Segments
$response_seg = Invoke-webrequest -WebSession $session -uri $($nsx_uri + "/policy/api/v1/infra/segments") -Method 'GET' -Headers $headers -usebasicparsing -Erroraction Stop
if ($response_seg.statuscode -eq '200') {
    # echo $response_seg.Content #print Json format
    $keyValue_seg= ConvertFrom-Json $response_seg.Content | Select-Object -expand "results"
    $sheet_seg = $keyValue_seg | select @{Name='Segment';Expression={$_.display_name}}, 
                                        @{Name='Connected-GW';Expression={$_.connectivity_path}},
                                        @{Name='Transport Zone';Expression={$_.transport_zone_path}},
                                        @{Name='Gateway'; Expression={$_.subnets.gateway_address}}, 
                                        @{Name='Type'; Expression={$_.type}}, 
                                        @{Name='Ports_Interfaces';Expression={0}},
                                        @{Name='Admin State'; Expression={$_.admin_state}},
                                        @{Name='Seg_ID'; Expression={$_.id}}
                                  
}
# RAW data check
#$sheet_seg | Sort-Object -Property Segment | Out-Gridview

#Query the Transport zones
$response_tz = Invoke-webrequest -WebSession $session -uri $($nsx_uri + "/api/v1/transport-zones") -Method 'GET' -Headers $headers -usebasicparsing -Erroraction Stop
if ($response_tz.statuscode -eq '200') {
    #echo $response_tz.Content
    $keyValue_tz= ConvertFrom-Json $response_tz.Content | Select-Object -expand "results"
    $sheet_tz = $keyValue_tz | select @{Name='TZ Name';Expression={$_.display_name}}, 
                                       @{Name='Type';Expression={$_.transport_type}},
                                       @{Name='ID';Expression={$_.id}}
                                        
}
#RAW data
#$sheet_tz |  Sort-Object -Property "TZ Name" | Out-Gridview

###########
#Replace RAW data with the right Name into Segments.
foreach($seg in $sheet_seg) {
    # Replace Tier-0s with Name (instead of raw data)
    if ($seg."Connected-GW" -ne $null) {
        $t0= $keyValue_t0s | Where-Object { $_.path -eq $($seg."Connected-GW") } | select display_name
        if ( $t0.display_name -ne $null) {
            $seg."Connected-GW" = $t0.display_name
        } 
    }  
    # Replace Tier-1s with Name (instead of raw data)
    if ($seg."Connected-GW" -ne $null) {
        $t1= $keyValue_t1s | Where-Object { $_.path -eq $($seg."Connected-GW") } | select display_name
        if ( $t1.display_name -ne $null) {
            $seg."Connected-GW" = $t1.display_name
        } 
    }  
    # Replace Transport Zone with Name (instead of raw data)
    if ($seg."Transport Zone" -ne $null) {
        $tz_id = $seg."Transport Zone".split("/")[7]
        $tz= $keyValue_tz | Where-Object { $_.id -eq $($tz_id) } | select display_name
        $seg."Transport Zone" = $tz.display_name
    }
    #Start-Sleep -Milliseconds 40
    #write-host $seg.Seg_ID
    $response_ports = Invoke-webrequest -WebSession $session -uri $($nsx_uri + "/policy/api/v1/infra/segments/$($seg.Seg_ID)/ports") -Method 'GET' -Headers $headers -usebasicparsing -Erroraction Stop
    if ($response_ports.statuscode -eq '200') {
        #echo $response_ports.Content       
        $seg."Ports_Interfaces" = (ConvertFrom-Json $response_ports.Content |  select "result_count").result_count                   
    }
}

#$sheet_seg | Sort-Object -Property Segment | Out-GridView
$sheet_seg | Sort-Object -Property Segment | Export-Excel

write-host 
Write-Host -foreground Green "Script correctly executed on NSX:"$nsx_manager

    
... and the result looks like the follow:

I hope it will be useful.

That's it.

mercoledì 4 dicembre 2024

[NSX] Edge VM Present In NSX Inventory Not Present In vCenter

Issue


Today while I was deleting edge bridges from NSX Manager I got this error message:

Edge VM Present In NSX Inventory Not Present In vCenter
Description The VM edge-bridge-cluster1-B with moref id vm-1370430 corresponding to the Edge Transport node a060574d-4e93-4b7e-83b4-7eb8464a645d vSphere placement parameters is found in NSX inventory but is not present in vCenter. Please check if the VM has been removed in vCenter or is present with a different VM moref id.

Recommended Action The managed object reference moref id of a VM has the form vm-number, which is visible in the URL on selecting the Edge VM in vCenter UI. Example vm-12011 in https:///ui/app/vm;nav=h/urn:vmomi:VirtualMachine:vm-12011:164ff798-c4f1-495b-a0be-adfba337e5d2/summary Please find the VM edge-bridge-cluster1-B with moref id vm-1370430 in vCenter for this Edge Transport Node a060574d-4e93-4b7e-83b4-7eb8464a645d. If the Edge VM is present in vCenter with a different moref id, please follow the below action. Use NSX add or update placement API with JSON request payload properties vm_id and vm_deployment_config to update the new vm moref id and vSphere deployment parameters. POST https:///api/v1/transport-nodes/?action=addOrUpdatePlacementReferences. If the Edge VM with name edge-bridge-cluster1-B is not present in vCenter, use the NSX Redeploy API to deploy a new VM for the Edge node. POST https:///api/v1/transport-nodes/?action=redeploy.

Solution


Googling around I found various solutions, but no one was fitting exactly my situation.

For example I found these:
VMware NSX Edge VMs not present in both NSX and vCenter
Edge VM present in NSX inventory not present in vCenter alarm

As shown into the first link I tried without success the command described in Scenario 3:
So, I also tried to check if the Transport Nodes was still present into NSX, whit commands below:
No trace of them. It seems like, the deletion process has not finished. I waited 30 minutes, but the problem was still there.

I solved restarting one by one the NSX Manager appliances.
I started rebotting the first appliance, waited for the cluster to return to a "stable" state, and continued with the next appliance, until I had restarted them all. At the last reboot the error message changed from "Open" to "Resolved" and was no longer present

That's it.

lunedì 2 dicembre 2024

[NSX] - API Authentication Using a Session Cookie on PowerShell

Issue


Recently I had to create a PowerShell script that grab some information from NSX via Rest API calls. To do so, I had to create a few lines of code to authenticate on the NSX.
To reduce the number of times that I have to enter username and password and/or they transit over the network, I used NSX session-based authentication method to generate a JSESSIONID cookie when using the API as described here.
The method describe how to create a new session cookie and how to use thex-xsrf-token for subsequent requests for cURL on linux environment. Below here I wrote few lines of code to use the same method in powershell environment.
Let's see below how does it works for powershell ....

Solution


The script must run on an Windows machine, so I decided to make a powershell script. Information regarding api call, can be found at the following link https://developer.vmware.com/apis
I thought was useful share with everyone how to do it, let's see the script:
#
# Create a Session Token 
#
# LM v. 0.2
#
# This script is an example on how to create a session token on NSX and reuse for subsequent requests.
# 


#Script accept in input the FQDN of the NSX Manager to connect on, or leave it blank to use the default "nsx-mgr.vcf.sddc.lab"
param(
    [string] $nsx_manager = 'nsx-mgr.vcf.sddc.lab'
)

#Used to manage/skip certificates
add-type @"
using System.Net;
using System.Security.Cryptography.X509Certificates;
public class TrustAllCertsPolicy : ICertificatePolicy {
    public bool CheckValidationResult(
        ServicePoint srvPoint, X509Certificate certificate,
        WebRequest request, int certificateProblem) {
        return true;
    }
}
"@
$AllProtocols = [System.Net.SecurityProtocolType]'Ssl3,Tls,Tls11,Tls12'
[System.Net.ServicePointManager]::SecurityProtocol = $AllProtocols
[System.Net.ServicePointManager]::CertificatePolicy = New-Object TrustAllCertsPolicy


function createSession {
    $script:session = New-Object Microsoft.PowerShell.Commands.WebRequestSession
    $script:headers = @{}
    $script:nsx_uri = "https://" + $nsx_manager
    $uri = $nsx_uri + "/api/session/create"
    $private:body = "j_username=$($nsx_user)&j_password=$($nsx_pass)" 
    try {
        $response = invoke-webrequest -contentType "application/x-www-form-urlencoded" -WebSession $session -uri $uri -Method 'POST' -Body $body -usebasicparsing -Erroraction Stop
        $xsrftoken = $response.headers["X-XSRF-TOKEN"]
 
        #$response
        $script:loginSuccess = $true
        $script:headers.Add("X-XSRF-TOKEN", $xsrftoken)
        $script:headers.Add("Accept", "application/json")
        $script:headers.Add('Content-Type','"application/x-www-form-urlencoded')
    }
    catch {
        Write-Host "Failed" -ForegroundColor Red
        Write-Host "$($_.Exception)" -ForegroundColor Red
        write-host "Error Details:" $_.ErrorDetails.Message -ForegroundColor Magenta
        $script:loginSuccess = $false
    }
}

#If you want insert Credential on fly uncomment the three lines below here and comment the hardcoded credentials 
#$MyCredential = Get-Credential -Message "Insert $nsx_manager "
#$nsx_user = $MyCredential.UserName
#$nsx_pass = [Runtime.InteropServices.Marshal]::PtrToStringAuto([Runtime.InteropServices.Marshal]::SecureStringToBSTR($MyCredential.Password))

#Harcoded credentials; uncomment if you don't want to insert them with Get-Credential function or comment otherwise
$nsx_user = 'admin'
$nsx_pass = 'VMware123!VMware123!'

#Create the cookie session 
createSession


#how looks like subsequent example requests
#List of segments
$response_q1 = Invoke-webrequest -WebSession $session -uri $($nsx_uri + "/policy/api/v1/infra/segments") -Method 'GET' -Headers $headers -usebasicparsing -Erroraction Stop

#List of tier-1s
$response_q2 = invoke-webrequest -WebSession $session -uri $($nsx_uri + "/policy/api/v1/infra/tier-1s") -Method 'GET' -Headers $headers -usebasicparsing -Erroraction Stop

write-host " ----- Segments ----- " -ForegroundColor Green
write-host $response_q1.Content
write-host 
write-host 
write-host " ----- Tier-1s ----- " -ForegroundColor Green
#write-host $response_q2.Content

# END #

That's it.

venerdì 29 novembre 2024

[NSX Edge] NIC ring out of buffer

Issue


Recently I faced out on this issue:
Description Edge NIC fp-eth1 transmit ring buffer has overflowed by 100.000000% on Edge node cd5c7792-1e62-48bb-b6da-40e8eea154b7. The missed packet count is 420560 and processed packet count is 0.

Recommended Action 1. If a lot of VMs are accommodated along with edge by the hypervisor then edge VM might not get time to run, hence the packets might not be retrieved by hypervisor. Then probably migrating the edge VM to a host with fewer VMs. 2. Increase the ring size by 1024 using the command `set dataplane ring-size tx `. If even after increasing the ring size, the issue persists then contact VMware Support as the ESX side transmit ring buffer might be of lower value. If there is no issue on ESX side, it indicates the edge needs to be scaled to a larger form factor deployment to accommodate the traffic. 3. If the alarm keeps on flapping, i.e., triggers and resolves very soon, then it is due to bursty traffic. In this case check if tx pps using the command `get dataplane cpu stats`. If it is not high during the alarm active period then contact VMware Support. If pps is high it confirms bursty traffic. Consider suppressing the alarm. NOTE - There is no specific benchmark to decide what is regarded as a high pps value. It depends on infrastructure and type of traffic. The comparison can be made by noting down when alarm is inactive and when it is active.

Solution


Checking for recommended actions ...
edge-bridge-cluster3-A> get dataplane | find ring
Wed Nov 20 2024 UTC 12:16:02.831
Bfd_ring_size      : 512   
Lacp_ring_size     : 512   
Learning_ring_size : 512   
Livetrace_ring_size: 512   
Rx_ring_size       : 4096  
Slowpath_ring_size : 512   
Tx_ring_size       : 4096
... rx and tx ring_size was already at 4096. Looking for flow-cache ...
edge-bridge-cluster3-A> get dataplane flow-cache config
Wed Nov 20 2024 UTC 12:16:50.970
Enabled            : true
Mega_hard_timeout_ms: 4955
Mega_size          : 262144
Mega_soft_timeout_ms: 4904
Micro_size         : 262144
... we saw that the value can be incremented up to 524288. We incremented it and restarted the dataplane service
edge-bridge-cluster3-A> set dataplane flow-cache-size 524288
edge-bridge-cluster3-A> restart service dataplane

edge-bridge-cluster3-A> get dataplane flow-cache config
Wed Nov 20 2024 UTC 12:25:38.810
Enabled            : true
Mega_hard_timeout_ms: 4955
Mega_size          : 524288
Mega_soft_timeout_ms: 4904
Micro_size         : 524288
What does flow-cache do?
Flow Cache helps reduce CPU cycles spent on known traffic flows. NSX Edge node uses flow cache to achieve high packet throughput. This feature records actions applied on each flow when the first packet in the flow is processed so that subsequent packets can be processed using a match-and-action procedure.

When the key collisions rates are high, increasing the flow cache size help process the packets most efficiently. However, increasing the cache size might impact memory consumption. Typically, the higher the hit rates, the better the performance.

After this change I also proceeded to free up the host where the Edge was running by migrating the VMs elsewhere.
This was enough to solve my problem. The VMs on the bridged segments became newly available.

Looking around; we saw a nice analysis done by Giuliano on a similar issue at this link.

Further helpful information on the same topics can be found at the following links:

https://docs.vmware.com/en/VMware-Telco-Cloud-Platform/3.0/telco-cloud-platform-5g-edition-data-plane-performance-tuning-guide/GUID-64EEE4A0-23C1-49DB-AE4D-F235F8AB8EAB.html

https://knowledge.broadcom.com/external/article/330475/edge-nic-out-of-receive-buffer-alarm.html

https://knowledge.broadcom.com/external/article?legacyId=80233

That's it.

giovedì 31 ottobre 2024

[NSX] Dump of the VMs list and its Security TAGs

Issue


Recently I had to create a script that periodically take a snapshot of the current situation regarding the list of Virtual Machines and the associated NSX Security Tags, via rest API calls.
To do this, I had to create some lines of code. Let's see below, the call to get the list of VMs and how it works....

Solution


The script must run on an Ubuntu machine, so I decided to make a bash script and use cURL. Information regarding api call, can be found at the following link https://developer.vmware.com/apis
More specific information regarding NSX, can be found here.

Our call to retrieve informations, looks like this:
curl -sk -u username:password -X GET 'https://{nsx_manager}/policy/api/v1/infra/realized-state/virtual-machines' > vms-all.json
... and from terminal using the "jq" command (with the options "-r '.results[]' ") ...
jq -r ' .results[]' vms-all.json
... the output is as below ...


Now, that we have the whole VMs list on a file, we are able to query it with 'jq' and retrieve information we need such as:
  • we can search for a whole json configuration of a specific VM (for example "db-01a") ...
    jq -r ' .results[] | select(.display_name=="db-01a") ' vms-all.json

  • we can search for the tags of a specific VM (for example "db-01a")
    jq -r ' .results[] | select(.display_name=="db-01a") | .tags' vms-all.json

  • we can count how many VMs are present into the list
    jq -c ' .results[] | [.display_name, .tags]" vms-all.json | wc -l

  • we can list all VMs with their tags
    jq -c ' .results[] | [.display_name, .tags]' vms-all.json

  • .... and so on.

That's it.

giovedì 7 settembre 2023

[NAPP] Helm pull chart operation failed.

Issue


Yesterday I was trying to deploy the NSX Application Platform (NAPP) in automated way. Below my environment:

• NSX-T version 3.2.3.0.0.21703624
• NAPP version 4.0.1-0.0-20606727

when I received the following error message:

status Code is 400, body: {"httpStatus" : "BAD REQUEST", "error_code" : 46013, "module_name" : "NAPP", "error_message" : "Helm pull chart operation failed. Error: failed to fetch https://projects.registry.vmware.com/chartrepo/nsx_application_platform/charts/nsxi-platform-standard-4.0.1-0.0-20606727.tgz : 404 Not Found\\n"}

Then I tried to deploy it manually, but I received the following error message (very similar to the previous one):

Error: Helm pull chart operation failed. Error: failed to fetch provenance https://projects.registry.vmware.com/chartrepo/nsx_application_platform/charts/nsxi-platform-standard-4.0.1-0.0-20606727.tgz.prov\n (Error code: 46013)


Before to see the solution a brief introduction to what NAPP is.

The NSX Application Platform is a modern microservices platform that hosts the following NSX features that collect, ingest, and correlate network traffic data in your NSX environment.
  • VMware NSX® Intelligence™
  • VMware NSX® Network Detection and Response™
  • VMware NSX® Malware Prevention
  • VMware NSX® Metrics

NAPP is a microservices application platform based on Kubernets and can be installed in two ways:
  • manually
  • automated

By choosing an automated NAPP installation, the customer does not need to be concerned with the installation and maintenance of the individual NAPP platform components including TKGs (Kubernetes).
Further information on how to "Getting Started with NSX Application Platform (NAPP)" can be found here.

Solution


Asking at the VMware GSS for help they told me the following:

"Due to an upgrade of the VMware Public Harbor registry to version 2.8.x ChartMuseum support has been deprecated and removed. And OCI is now the only supported access method. This unfortunately impacts NAPP deployment using NSX version 3.2.x which relies on ChartMuseum.

Option - 1 - Upgrade the environment to 3.2.3.1 and proceed with OCI URLs. Alternatively, any NSX 4.x release will also work.

Option - 2 - Wait for patches.

Once the environment is upgraded use the following URLs

Helm Repository - oci://projects.registry.vmware.com/nsx_application_platform/helm-charts
Docker Registry - projects.registry.vmware.com/nsx_application_platform/clustering"

That's it.

lunedì 14 agosto 2023

[NAPP] Deployment get stuck on "Create Guest Custer "

Issue


Deployment of NAPP get stucked on "Create Guest Cluster - Waiting for Guest cluster napp-cluster-01 to be available for login ..."
Looking at the vCenter, we can see that the SupervisorControlPlaneVM(s) has been created correctly, as well as the namespace and napp-cluster-01-control-plane VM.
What we don't see here are the workers VM.

Solution


To investigate and troubleshoot the the issue we connect via ssh on the SupervisorControlPlaneVM. I will explain in another post how to get the credentials to access the SV CP.

Describing the NAPP TKC ...
# kubectl describe tkc napp-cluster-01 -n nsx-01
we found 2 errors:

Message:          2 errors occurred:
                         * failed to configure DNS for /, Kind= nsx-01/napp-cluster-01: unable to reconcile kubeadm ConfigMap's CoreDNS info: unable to retrieve kubeadm Configmap from the guest cluster: configmaps "kubeadm-config" not found
                         * failed to configure kube-proxy for /, Kind= nsx-01/napp-cluster-01: unable to retrieve kube-proxy daemonset from the guest cluster: daemonsets.apps "kube-proxy" not found


Looking the deployment state of the workers node..
# kubectl get wcpmachine,machine,kcp,vm -n nsx-01

.. we saw that the workers node were still in Pending state. We describe the worker node ...
# kubectl describe wepmachine.infrastructure.cluster.vmware.com/napp-cluster-01-workers-qlpm6-7h2qr -n nsx-01
We also debugged Kubernetes with crictl command looking inside the logs
... and so on.

Tried to Ping from Supervisor cluster to the TKC VIP:
# kubectl get svc -A | grep -i napp-cluster-01
nsx-01                                      napp-cluster-01-control-plane-service                           LoadBalancer   10.96.1.25    192.168.100.25   6443:32296
At the end, we discovered that we were unable to :
  • ping from SupervisorControlPlane to Tanzu Kubernetes Cluster VIP
  • ping from TKC CP to Supervisor CP
Allowed connection on the firewall from SV CP to TKC VIP & from TKC CP to Supervisor CP, we never saw the error any more, but the state was still in pending.

So, we removed the namespace and re-deployed, now control-plane and workers node are UP and running ad we can contiune with NAPP installation.

That's it.

mercoledì 9 agosto 2023

[NSX-T] Stale logical-port(s) still connected in NSX-T 3.x

Issue


I was cleaning up a customer's NSX-T configuration to bring some changes, when I saw a lot of logical-ports still connected, more than hundred even if VM was no more present on vCenter.

Solution


I immediately thought of creating a script with rest APIs calls to remove the logical ports from NSX-T Manager. It is possible to find all the NSX-T API calls here.

For rest APIs calls within the bash script I will be using cURL with the suggestions provided here.

First, let's see the rest APIs to use:
  1. to retrieve the IDs of the Logical Ports
  2. to delete the connection

To get the list of Logical-Ports:
GET /api/v1/logical-ports

Below how it looks the command line ...
# lorenzo@ubuntu:~$ curl -ksn -X GET https://{NSX-T MANAGER IP}/api/v1/logical-ports 
... combining to the previous line the jq command and sed, we can extract only the ID field of our interst.
# lorenzo@ubuntu:~$ curl -ksn -X GET https://{NSX-T MANAGER IP}/api/v1/logical-ports |  jq '.results[] | .id' | sed 's/"//g' 
Outcome in the image below.


To get the deletion of the Logical-Port:
DELETE /api/v1/logical-ports/<LogicalPort-ID>?detach=true

We now have all the elements to build the bash script, which looks like the one below...

WARNING: It provided witout warranty. Use it at your own risk and only if you are aware of what you are doing

#!/bin/bash
curl -ksn -X GET https://{NSX-T MANAGER IP}/api/v1/logical-ports |  jq '.results[] | .id' | sed 's/"//g' | while read -r LP_ID
do
 curl -ksn -X DELETE https://{NSX-T MANAGER IP}/api/v1/logical-ports/${LP_ID}?detach=true
 echo " -> "${LP_ID}" removed "
done
... launch the script as below ...
lorenzo@ubuntu:~$ bash remove_all_logical_port.sh 
... the result is the following. All Logial-Ports have been cancelled.


That's it.

mercoledì 26 luglio 2023

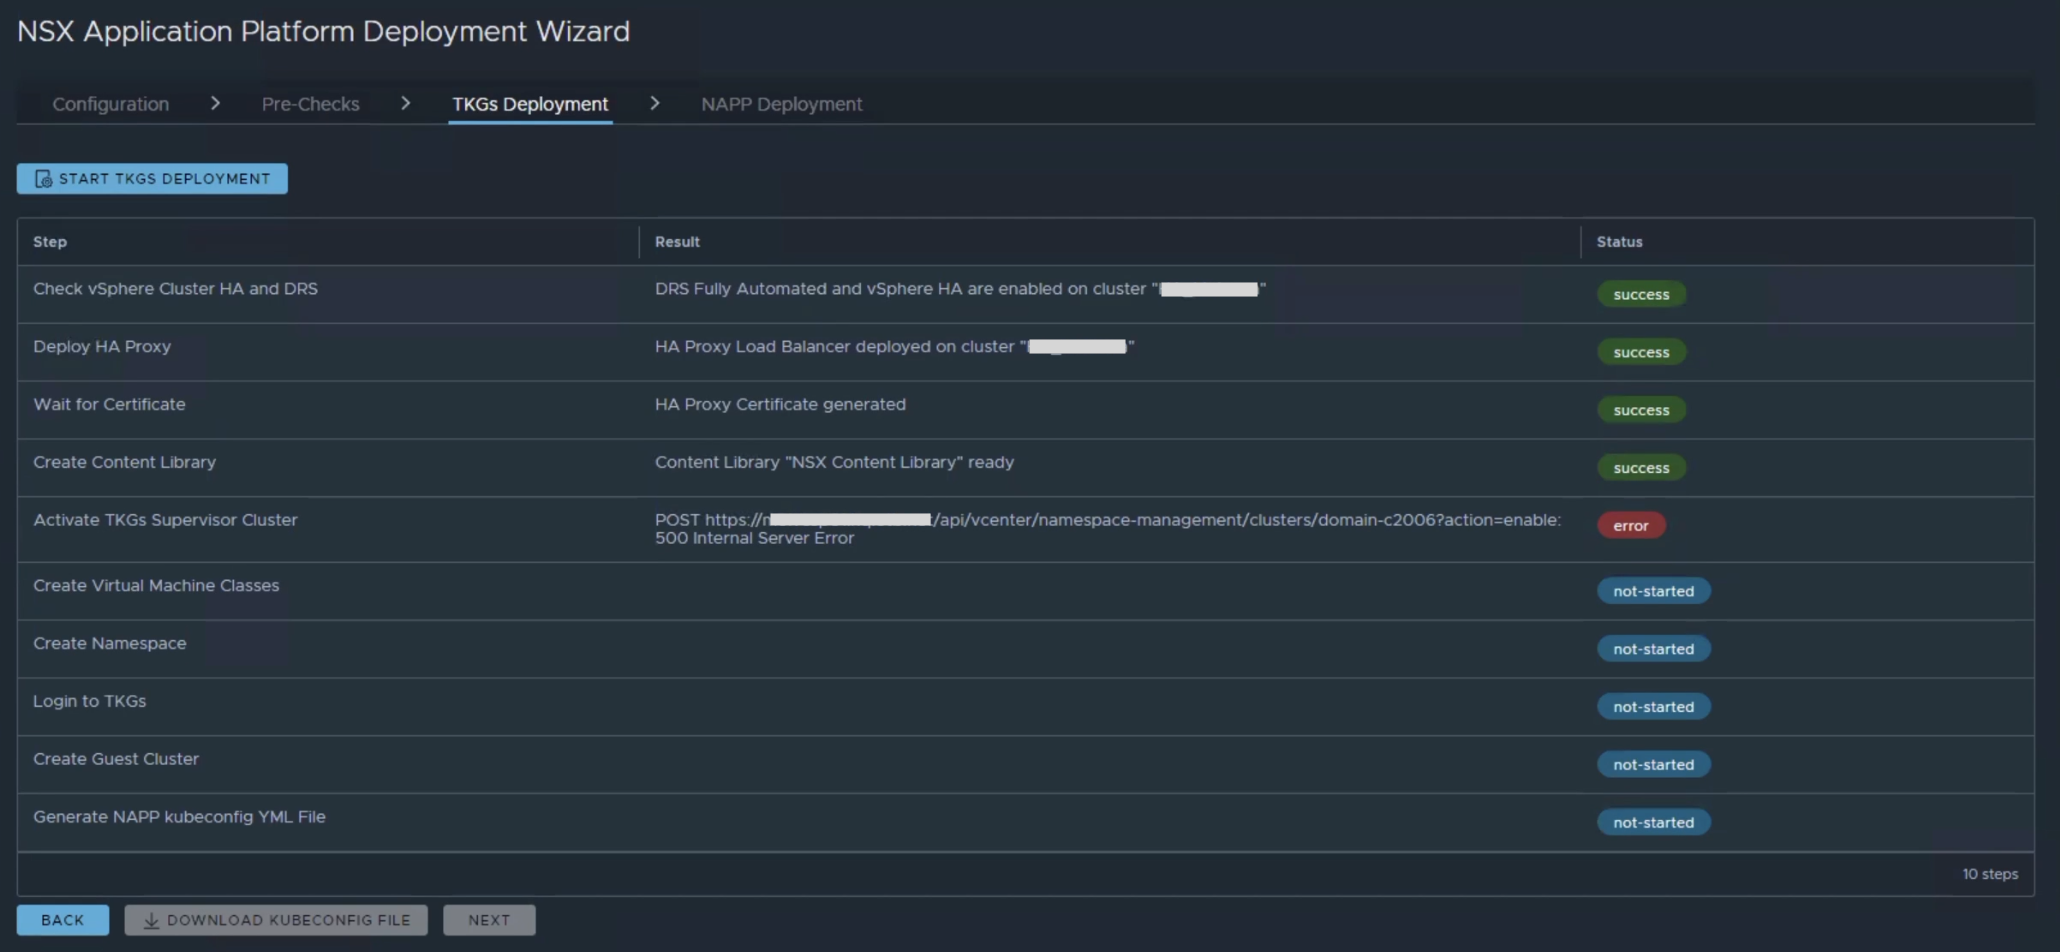
[NAPP] - Activate TKGs Supervisor Cluster: 500 Internal Server Error

Issue


Today I was deploying the NSX Application Platform (NAPP) in automated way, when I received the following error message:

[Activate TKGs Supervisor Cluster] POST https://{vCenter}/api/vcenter/namespace-management/clusters/domain-c{ID}?action=enable: 500 Internal Server Error


Before to see the solution a brief introduction to what NAPP is.

The NSX Application Platform is a modern microservices platform that hosts the following NSX features that collect, ingest, and correlate network traffic data in your NSX environment.
  • VMware NSX® Intelligence™
  • VMware NSX® Network Detection and Response™
  • VMware NSX® Malware Prevention
  • VMware NSX® Metrics

NAPP is a microservices application platform based on Kubernets and can be installed in two ways:
  • manually
  • automated

By choosing an automated NAPP installation, the customer does not need to be concerned with the installation and maintenance of the individual NAPP platform components including TKGs (Kubernetes).
Further information on how to "Getting Started with NSX Application Platform (NAPP)" can be found here.

Solution


The encountered error "500 internal server error" could be triggered if the vCenter/TKGs license is invalid as indicated here.

Tanzu licenses expired was exactly my case.
Looking inside the Workload Management, I discovered multiple incompatibilities.

Incompatibility reasons was related to "expired license".

Entered the new Tanzu license ... restarted the deployment task ... the process resumed from the previous point and TKGs was successfully deployed.

That's it.

lunedì 3 luglio 2023

How to quick check NSX DFW rules of a VMs on ESXi host

Issue


I need to know if a NSX-T firewall rules are deployed on a host and are applied to virtual machines.

Solution


The commands to use to verify that the firewall rules are deployed on a host and are applied to virtual machines are :
# summarize-dvfilter and  vsipioctl
Let's see how to use them below, I would like to say that those tests were carried out on the HOL (hands on labs) made available by vmware, but nothing change on the real life.

In our test, we would like to validate the DFW rule for the VM web-01a.
Located the VM that we want to validate we get SSH into the ESXi host.

So, once logged in, we type ...
# summarize-dvfilter | grep -A 3 vmm0:web-01a 
... and we look for the name under vNIC slot.

Then to show the appliade rules, we use the command vsipioctl getrules like below:
# vsipioctl getrules -f nic-269171-eth0-vmware-sfw.2 

Alternatively, we can use the combined commands as follows ...
# vsipioctl getrules -f `summarize-dvfilter | grep -A 3 vmm0:web-01a | grep name | awk '{print $2}'` 


As we can see from the previous picture, the rules ID 2031, 2032, 2033 are not present on the VM. Why??
Simply, because they are not enabled.

Once enabled and published ...

...if we rerun the command ...
# vsipioctl getrules -f `summarize-dvfilter | grep -A 3 vmm0:web-01a | grep name | awk '{print $2}'` 
... we can see now, them applied to the VM.

That's it.