giovedì 7 settembre 2023

[NAPP] Helm pull chart operation failed.

Issue


Yesterday I was trying to deploy the NSX Application Platform (NAPP) in automated way. Below my environment:

• NSX-T version 3.2.3.0.0.21703624
• NAPP version 4.0.1-0.0-20606727

when I received the following error message:

status Code is 400, body: {"httpStatus" : "BAD REQUEST", "error_code" : 46013, "module_name" : "NAPP", "error_message" : "Helm pull chart operation failed. Error: failed to fetch https://projects.registry.vmware.com/chartrepo/nsx_application_platform/charts/nsxi-platform-standard-4.0.1-0.0-20606727.tgz : 404 Not Found\\n"}

Then I tried to deploy it manually, but I received the following error message (very similar to the previous one):

Error: Helm pull chart operation failed. Error: failed to fetch provenance https://projects.registry.vmware.com/chartrepo/nsx_application_platform/charts/nsxi-platform-standard-4.0.1-0.0-20606727.tgz.prov\n (Error code: 46013)


Before to see the solution a brief introduction to what NAPP is.

The NSX Application Platform is a modern microservices platform that hosts the following NSX features that collect, ingest, and correlate network traffic data in your NSX environment.
  • VMware NSX® Intelligence™
  • VMware NSX® Network Detection and Response™
  • VMware NSX® Malware Prevention
  • VMware NSX® Metrics

NAPP is a microservices application platform based on Kubernets and can be installed in two ways:
  • manually
  • automated

By choosing an automated NAPP installation, the customer does not need to be concerned with the installation and maintenance of the individual NAPP platform components including TKGs (Kubernetes).
Further information on how to "Getting Started with NSX Application Platform (NAPP)" can be found here.

Solution


Asking at the VMware GSS for help they told me the following:

"Due to an upgrade of the VMware Public Harbor registry to version 2.8.x ChartMuseum support has been deprecated and removed. And OCI is now the only supported access method. This unfortunately impacts NAPP deployment using NSX version 3.2.x which relies on ChartMuseum.

Option - 1 - Upgrade the environment to 3.2.3.1 and proceed with OCI URLs. Alternatively, any NSX 4.x release will also work.

Option - 2 - Wait for patches.

Once the environment is upgraded use the following URLs

Helm Repository - oci://projects.registry.vmware.com/nsx_application_platform/helm-charts
Docker Registry - projects.registry.vmware.com/nsx_application_platform/clustering"

That's it.

lunedì 14 agosto 2023

[NAPP] Deployment get stuck on "Create Guest Custer "

Issue


Deployment of NAPP get stucked on "Create Guest Cluster - Waiting for Guest cluster napp-cluster-01 to be available for login ..."
Looking at the vCenter, we can see that the SupervisorControlPlaneVM(s) has been created correctly, as well as the namespace and napp-cluster-01-control-plane VM.
What we don't see here are the workers VM.

Solution


To investigate and troubleshoot the the issue we connect via ssh on the SupervisorControlPlaneVM. I will explain in another post how to get the credentials to access the SV CP.

Describing the NAPP TKC ...
# kubectl describe tkc napp-cluster-01 -n nsx-01
we found 2 errors:

Message:          2 errors occurred:
                         * failed to configure DNS for /, Kind= nsx-01/napp-cluster-01: unable to reconcile kubeadm ConfigMap's CoreDNS info: unable to retrieve kubeadm Configmap from the guest cluster: configmaps "kubeadm-config" not found
                         * failed to configure kube-proxy for /, Kind= nsx-01/napp-cluster-01: unable to retrieve kube-proxy daemonset from the guest cluster: daemonsets.apps "kube-proxy" not found


Looking the deployment state of the workers node..
# kubectl get wcpmachine,machine,kcp,vm -n nsx-01

.. we saw that the workers node were still in Pending state. We describe the worker node ...
# kubectl describe wepmachine.infrastructure.cluster.vmware.com/napp-cluster-01-workers-qlpm6-7h2qr -n nsx-01
We also debugged Kubernetes with crictl command looking inside the logs
... and so on.

Tried to Ping from Supervisor cluster to the TKC VIP:
# kubectl get svc -A | grep -i napp-cluster-01
nsx-01                                      napp-cluster-01-control-plane-service                           LoadBalancer   10.96.1.25    192.168.100.25   6443:32296
At the end, we discovered that we were unable to :
  • ping from SupervisorControlPlane to Tanzu Kubernetes Cluster VIP
  • ping from TKC CP to Supervisor CP
Allowed connection on the firewall from SV CP to TKC VIP & from TKC CP to Supervisor CP, we never saw the error any more, but the state was still in pending.

So, we removed the namespace and re-deployed, now control-plane and workers node are UP and running ad we can contiune with NAPP installation.

That's it.

mercoledì 9 agosto 2023

[NSX-T] Stale logical-port(s) still connected in NSX-T 3.x

Issue


I was cleaning up a customer's NSX-T configuration to bring some changes, when I saw a lot of logical-ports still connected, more than hundred even if VM was no more present on vCenter.

Solution


I immediately thought of creating a script with rest APIs calls to remove the logical ports from NSX-T Manager. It is possible to find all the NSX-T API calls here.

For rest APIs calls within the bash script I will be using cURL with the suggestions provided here.

First, let's see the rest APIs to use:
  1. to retrieve the IDs of the Logical Ports
  2. to delete the connection

To get the list of Logical-Ports:
GET /api/v1/logical-ports

Below how it looks the command line ...
# lorenzo@ubuntu:~$ curl -ksn -X GET https://{NSX-T MANAGER IP}/api/v1/logical-ports 
... combining to the previous line the jq command and sed, we can extract only the ID field of our interst.
# lorenzo@ubuntu:~$ curl -ksn -X GET https://{NSX-T MANAGER IP}/api/v1/logical-ports |  jq '.results[] | .id' | sed 's/"//g' 
Outcome in the image below.


To get the deletion of the Logical-Port:
DELETE /api/v1/logical-ports/<LogicalPort-ID>?detach=true

We now have all the elements to build the bash script, which looks like the one below...

WARNING: It provided witout warranty. Use it at your own risk and only if you are aware of what you are doing

#!/bin/bash
curl -ksn -X GET https://{NSX-T MANAGER IP}/api/v1/logical-ports |  jq '.results[] | .id' | sed 's/"//g' | while read -r LP_ID
do
 curl -ksn -X DELETE https://{NSX-T MANAGER IP}/api/v1/logical-ports/${LP_ID}?detach=true
 echo " -> "${LP_ID}" removed "
done
... launch the script as below ...
lorenzo@ubuntu:~$ bash remove_all_logical_port.sh 
... the result is the following. All Logial-Ports have been cancelled.


That's it.
mercoledì 26 luglio 2023

[NAPP] - Activate TKGs Supervisor Cluster: 500 Internal Server Error

Issue


Today I was deploying the NSX Application Platform (NAPP) in automated way, when I received the following error message:

[Activate TKGs Supervisor Cluster] POST https://{vCenter}/api/vcenter/namespace-management/clusters/domain-c{ID}?action=enable: 500 Internal Server Error


Before to see the solution a brief introduction to what NAPP is.

The NSX Application Platform is a modern microservices platform that hosts the following NSX features that collect, ingest, and correlate network traffic data in your NSX environment.
  • VMware NSX® Intelligence™
  • VMware NSX® Network Detection and Response™
  • VMware NSX® Malware Prevention
  • VMware NSX® Metrics

NAPP is a microservices application platform based on Kubernets and can be installed in two ways:
  • manually
  • automated

By choosing an automated NAPP installation, the customer does not need to be concerned with the installation and maintenance of the individual NAPP platform components including TKGs (Kubernetes).
Further information on how to "Getting Started with NSX Application Platform (NAPP)" can be found here.

Solution


The encountered error "500 internal server error" could be triggered if the vCenter/TKGs license is invalid as indicated here.

Tanzu licenses expired was exactly my case.
Looking inside the Workload Management, I discovered multiple incompatibilities.

Incompatibility reasons was related to "expired license".

Entered the new Tanzu license ... restarted the deployment task ... the process resumed from the previous point and TKGs was successfully deployed.

That's it.

lunedì 10 luglio 2023

[DELL Server] - Lifecycle Controller in Recovery Mode

Issue


Today I was working on a new PowerEdge R650xs, when in a start up face I noticed the message "Lifecycle Controller in Recovery Mode"


Solution


To solve this issue, press F2 to enter in System Setup

Enter into iDrac Settings menu ...

... Lifecycle Controller

Select Enabled in Lifecycle Controller and click on Back

Hit Finish...

... and save changes pressing YES.

If the changes have been saved correctly, press OK and Reboot the system

At the next start up the error message is no longer present.

That's it.

lunedì 3 luglio 2023

How to quick check NSX DFW rules of a VMs on ESXi host

Issue


I need to know if a NSX-T firewall rules are deployed on a host and are applied to virtual machines.

Solution


The commands to use to verify that the firewall rules are deployed on a host and are applied to virtual machines are :
# summarize-dvfilter and  vsipioctl
Let's see how to use them below, I would like to say that those tests were carried out on the HOL (hands on labs) made available by vmware, but nothing change on the real life.

In our test, we would like to validate the DFW rule for the VM web-01a.
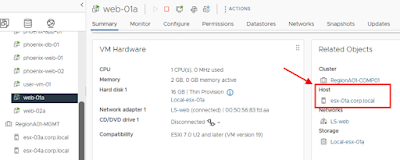
Located the VM that we want to validate we get SSH into the ESXi host.

So, once logged in, we type ...
# summarize-dvfilter | grep -A 3 vmm0:web-01a 
... and we look for the name under vNIC slot.

Then to show the appliade rules, we use the command vsipioctl getrules like below:
# vsipioctl getrules -f nic-269171-eth0-vmware-sfw.2 

Alternatively, we can use the combined commands as follows ...
# vsipioctl getrules -f `summarize-dvfilter | grep -A 3 vmm0:web-01a | grep name | awk '{print $2}'` 


As we can see from the previous picture, the rules ID 2031, 2032, 2033 are not present on the VM. Why??
Simply, because they are not enabled.

Once enabled and published ...

...if we rerun the command ...
# vsipioctl getrules -f `summarize-dvfilter | grep -A 3 vmm0:web-01a | grep name | awk '{print $2}'` 
... we can see now, them applied to the VM.

That's it.

venerdì 16 giugno 2023

Quick tip for cURL users

Issue


I often use Rest API calls with the cURL command to interact with NSX manager, and every time I have to enter the login credentials.
It would be useful to have a place somewhere to store them so that you don't have to enter them every time (especially when you are on a call with customer, and you cannot write in clear text the password with the -u option ..... and you are therefore forced to type and/or copy password several times).

Solution


Looking around in "Using curl" site I discovered .netrc .
In short, it is possible to store username, password and IP/FQDN of the machine to connect to, in file ~/.netrc so that you do not need to type username and password in every API call you invoke.
The ~/.netrc file format is simple: you specify lines with a machine name and follow that with the login and password that are associated with that machine, and looks like the below:
% cat .netrc 
machine <IP/FQDN_1> login <username_here> password <password_1_here>
machine <IP/FQDN_2> login <username_here> password <password_2_here>
% 
Below an example
lorenzo@moglielL0KPF ~ % cat .netrc 
machine 172.25.251.31 login admt1lm@dominio.local password VMware1!VMware1!
machine nsxtmgr01.customer2.local login admin password VMware!123VMware!123
lorenzo@moglielL0KPF ~ % 
It is now possible to invoke the Rest API call with the -n switch to cURL to use netrc file.
We can check NSX Manager FQDNs using NSX-T Data Center API with -n option as below:
curl -k -n -X GET https://172.25.251.31/api/v1/configs/management
Further information about the parameters you can use in file .netrc or how to use it in Windows can be found on this site.

That's it.

lunedì 12 giugno 2023

NSX-T host preparation - Upgrade VIB(s) "loadesx" is required

Issue


I was trying to perform NSX-T host preparation on a cluster (based on HPe Simplivity) composed of two Esxi hosts, when I received the following error message:

Failed to install software on host. Failed to install software on host. Simplivity.host.local : java.rmi.RemoteException: [InstallationError] Upgrade VIB(s) "loadesx" is required for the transaction. Please use a depot with a complete set of ESXi VIBs. Please refer to the log file for more details.

Solution


After investigating, I don't actually find the installed VIB...
# esxcli software vib list | grep load

I check the profile on the ESXi host ...
# esxcli software profile get
The current update was done with custom bundles,

The customer confirms that during the update phase, he skipped the installation because otherwise he would not have been able to update the drivers.

I then asked the customer to retrieve the Offline Bundle package used for the update.

I copied the same Offline Bundle used for the upgrade into a shared folder by the cluster hosts.
I checked the Offline Bundle profile ...
# esxcli software sources profile list -d /vmfs/volumes/SVT-VDI/Temp/HPe/Q8A57-11137_hpe-esxi7.0u3c-19193900-703.0.0.10.8.1-3-offline-bundle.zip
... and then the contents of the VIBs, to verify that was present "loadesx" ...
# esxcli software sources profile get -d /vmfs/volumes/SVT-VDI/Temp/HPe/Q8A57-11137_hpe-esxi7.0u3c-19193900-703.0.0.10.8.1-3-offline-bundle.zip -p HPE-ESXi-7.0-Update3c-19193900-customized
Verified the presence, I proceed with the update of the profile in this way:
# esxcli software profile update -d /vmfs/volumes/SVT-VDI/Temp/HPe/Q8A57-11137_hpe-esxi7.0u3c-19193900-703.0.0.10.8.1-3-offline-bundle.zip -p HPE-ESXi-7.0-Update3c-19193900-customized
As we can see above, there are a number of packages that have been installed/updated including “loadesx”.

Since a reboot is required, let's proceed with rebooting the ESXi host.

Post Reboot we verify that the module has been properly loaded ...
# esxcli software vib list | grep load


Back to NSX-T UI
Click on Install Failed of the host we just updated, then VIEW ERRORS
Select the error message and click RESOLVE
Click RESOLVE again.
I check the progress of the installation process ...
I also check via command line ...
# esxcli software vib list | grep -i nsx
Verified that the NSX-T packages have been correctly installed on the ESXi host (NSX Configuration: Success), and the status of the host in NSX-T is UP... I proceed to perform the same tasks with the next host.

Now, all hosts are UP and running.

That's it.