giovedì 25 febbraio 2021

ssh_init: Network error: Cannot assign requested address

Issue


I needed to upload some files on a VM Photon OS version 3.0 using pscp.exe tool, from Windows machine.
But i obtain the following error message ...

ssh_init: Network error: Cannot assign requested adress

Solution


In my case the solution was to specify the port with -P 22 option as shown in the picture below

That's it.

venerdì 19 febbraio 2021

Elasticsearch on Workspace One Access (former vIDM) start and exit with status 7

Issue


This week I had problem with elasticsearch service on Workspace ONE Access (former VIDM) part of the new VMware Cloud Foundation environment (VCF Version 4.X). It seems that the service has some problem in the startup phase on all the nodes that compose the cluster. 'elasticsearch start' exits with status 7.
Workspace One Access version is 3.3.2-15951611.

Opening the console was present an Error message like “Error: Error log is in /var/log/boot.msg.”
Part of the message are reported below:
 No JSON object could be decoded
Traceback (most recent call last):
  File "<string>", line 1, in <module>
  File "/usr/lib64/python2.6/json/__init__.py", line 267, in load
    parse_constant=parse_constant, **kw)
  File "/usr/lib64/python2.6/json/__init__.py", line 307, in loads
    return _default_decoder.decode(s)
  File "/usr/lib64/python2.6/json/decoder.py", line 319, in decode
    obj, end = self.raw_decode(s, idx=_w(s, 0).end())
  File "/usr/lib64/python2.6/json/decoder.py", line 338, in raw_decode
    raise ValueError("No JSON object could be decoded")
ValueError: No JSON object could be decoded
Number of nodes in cluster is : 
Configuring /opt/vmware/elasticsearch/config/elasticsearch.yml file
Starting elasticsearch: 
<notice -- Feb 15 15:05:17.122319000> 'elasticsearch start' exits with status 7
<notice -- Feb 15 15:05:17.130417000> hzn-dots start
Application Server already running.
<notice -- Feb 15 15:05:17.339108000> 'hzn-dots start' exits with status 0
Master Resource Control: runlevel 3 has been reached
Failed services in runlevel 3: elasticsearch
Skipped services in runlevel 3: splash
<notice -- Feb 15 15:05:17.340630000> 
killproc: kill(456,3)

Solution


Disclaimer: Procedures described below, if you are not fully aware of what you are changing, it is advisable to make the changes with the help of the VMware GSS to prevent the environment from becoming unstable. Use it at your own risk.

Short Answer
We just need to run the following commands on each Workspace ONE Access appliance, to understand if nodes communicates each other, and so on..

  • Check how many nodes are part of the cluster:
    curl -s -XGET http://localhost:9200/_cat/nodes
  • Check cluster health:
    curl http://localhost:9200/_cluster/health?pretty=true
  • Check the queue list of rabbitmq
    rabbitmqctl list_queues | grep analytics
  • If the cluster health is red run these commands:
    • to find UNASSIGNED SHARDS:
      curl -XGET localhost:9200/_cat/shards?h=index,shard,prirep,state,unassigned.reason | grep UNASSIGNED
    • to DELETE SHARDS:
      curl -XGET http://localhost:9200/_cat/shards | grep UNASSIGNED | awk {'print $1'} | xargs -i curl -XDELETE "http://localhost:9200/{}"
  • Recheck the health to insure it is green and once green ....
    curl http://localhost:9200/_cluster/health?pretty=true
  • ... then check the elastic search if it is working or not.

  • Nodes may need to be restarted. Proceed as follows:
    • turn off 2 nodes and leave one active
    • turn on a node again (at time), wait for it to appear in the cluster and start correctly
    • do the same with the third node
    • When the third is active and present in the cluster, perform a clean restart cycle also for the first node.


Long Answer (with command's output)
The commands that we will perform into the long answer will be the same already explained above, but we will report down here the output (of one node only). We remember that the commands must be performed on each nodes part of the cluster.

  • Check how many nodes are part of the cluster:
    custm-vrsidm1:~ # curl -s -XGET http://localhost:9200/_cat/nodes
    10.174.28.18 10.174.28.18 6 98 0.31 d * Exploding Man
  • Check cluster health:
    custm-vrsidm1:~ # curl http://localhost:9200/_cluster/health?pretty=true
    {
      "cluster_name" : "horizon",
      "status" : "red",
      "timed_out" : false,
      "number_of_nodes" : 1,
      "number_of_data_nodes" : 1,
      "active_primary_shards" : 74,
      "active_shards" : 74,
      "relocating_shards" : 0,
      "initializing_shards" : 0,
      "unassigned_shards" : 146,
      "delayed_unassigned_shards" : 0,
      "number_of_pending_tasks" : 0,
      "number_of_in_flight_fetch" : 0,
      "task_max_waiting_in_queue_millis" : 0,
      "active_shards_percent_as_number" : 33.63636363636363
    }
  • Check the queue list of rabbitmq
    custm-vrsidm1:~ #  rabbitmqctl list_queues | grep analytics
    -.analytics.127.0.0.1   0
  • If the cluster health is red run these commands:
    • to find UNASSIGNED SHARDS:
      custm-vrsidm1:~ # curl -XGET localhost:9200/_cat/shards?h=index,shard,prirep,state,unassigned.reason| grep UNASSIGNED
        % Total    % Received % Xferd  Average Speed   Time    Time     Time  Current
                                       Dload  Upload   Total   Spent    Left  Speed
      100 11440  100 11440    0     0   270k      0 --:--:-- --:--:-- --:--:--  279k
      v4_2021-02-14     4 r UNASSIGNED CLUSTER_RECOVERED
      v4_2021-02-14     1 r UNASSIGNED CLUSTER_RECOVERED
      v4_2021-02-14     2 p UNASSIGNED CLUSTER_RECOVERED
      v4_2021-02-14     2 r UNASSIGNED CLUSTER_RECOVERED
      v4_2021-02-14     3 r UNASSIGNED CLUSTER_RECOVERED
      v4_2021-02-14     0 r UNASSIGNED CLUSTER_RECOVERED
      v4_2021-02-03     4 p UNASSIGNED CLUSTER_RECOVERED
      v4_2021-02-03     4 r UNASSIGNED CLUSTER_RECOVERED
      v4_2021-02-03     3 p UNASSIGNED CLUSTER_RECOVERED
      v4_2021-02-03     3 r UNASSIGNED CLUSTER_RECOVERED
      v4_2021-01-28     4 r UNASSIGNED CLUSTER_RECOVERED
      v4_2021-01-28     3 r UNASSIGNED CLUSTER_RECOVERED
      v4_2021-01-28     2 r UNASSIGNED CLUSTER_RECOVERED
      v4_2021-01-28     1 r UNASSIGNED CLUSTER_RECOVERED
      v4_2021-01-28     0 r UNASSIGNED CLUSTER_RECOVERED
      v2_searchentities 4 p UNASSIGNED CLUSTER_RECOVERED
      v2_searchentities 4 r UNASSIGNED CLUSTER_RECOVERED
      v2_searchentities 1 r UNASSIGNED CLUSTER_RECOVERED
      v2_searchentities 2 r UNASSIGNED CLUSTER_RECOVERED
      v2_searchentities 3 r UNASSIGNED CLUSTER_RECOVERED
      v2_searchentities 0 r UNASSIGNED CLUSTER_RECOVERED
      v4_2021-02-06     4 p UNASSIGNED CLUSTER_RECOVERED
      v4_2021-02-06     4 r UNASSIGNED CLUSTER_RECOVERED
      v4_2021-01-27     0 r UNASSIGNED CLUSTER_RECOVERED
      v4_2021-02-05     4 p UNASSIGNED CLUSTER_RECOVERED
      v4_2021-02-05     4 r UNASSIGNED CLUSTER_RECOVERED
      .................................................
      v4_2021-02-05     2 r UNASSIGNED CLUSTER_RECOVERED
      v4_2021-02-05     1 r UNASSIGNED CLUSTER_RECOVERED
      v4_2021-02-05     0 r UNASSIGNED CLUSTER_RECOVERED
      v4_2021-01-26     4 p UNASSIGNED CLUSTER_RECOVERED
      v4_2021-01-26     4 r UNASSIGNED CLUSTER_RECOVERED
      v4_2021-02-04     1 r UNASSIGNED CLUSTER_RECOVERED
      v4_2021-02-04     0 r UNASSIGNED CLUSTER_RECOVERED
    • to DELETE SHARDS:
      custm-vrsidm1:~ # curl -XGET http://localhost:9200/_cat/shards | grep UNASSIGNED | awk {'print $1'} | xargs -i curl -XDELETE "http://localhost:9200/{}"
        % Total    % Received % Xferd  Average Speed   Time    Time     Time  Current
                                       Dload  Upload   Total   Spent    Left  Speed
      100 16060  100 16060    0     0   589k      0 --:--:-- --:--:-- --:--:--  627k
      {"acknowledged":true}{"error":{"root_cause":[{"type":"index_not_found_exception","reason":"no such index","resource.type":"index_or_alias","resource.id":"v4_2021-02-14","index":"v4_2021-02-14"}],"type":"index_not_found_exception","reason":"no such index","resource.type":"index_or_alias","resource.id":"v4_2021-02-14","index":"v4_2021-02-14"},"status":404}{"error":{"root_cause":[{"type":"index_not_found_exception","reason":"no such index","resource.type":"index_or_alias","resource.id":"v4_2021-02-14","index":"v4_2021-02-14"}],"type":"index_not_found_exception","reason":"no such index","resource.type":"index_or_alias","resource.id":"v4_2021-02-14","index":"v4_2021-02-14"},"status":404}{"error":{"root_cause":[{"type":"index_not_found_exception","reason":"no such index","resource.type":"index_or_alias","resource.id":"v4_2021-02-14","index":"v4_2021-02-14"}],"type":"index_not_found_exception","reason":"no such index","resource.type":"index_or_alias","resource.id":"v4_2021-02-14","index":"v4_2021-02-14"},"status":404}{"error":{"root_cause":[{"type":"index_not_found_exception","reason":"no such index","resource.type":"index_or_alias","resource.id":"v4_2021-02-14","index":"v4_2021-02-14"}],"type":"index_not_found_exception","reason":"no such index","resource.type":"index_or_alias","resource.id":"v4_2021-02-14","index":"v4_2021-02-14"},"status":404}{"error":{"root_cause":[{"type":"index_not_found_exception","reason":"no such index","resource.type":"index_or_alias","resource.id":"v4_2021-02-14","index":"v4_2021-02-14"}],"type":"index_not_found_exception","reason":"no such index","resource.type":"index_or_alias","resource.id":"v4_2021-02-14","index":"v4_2021-02-14"},"status":404}{"acknowledged":true}{"error":{"root_cause":[{"type":"index_not_found_exception","reason":"no such index","resource.type":"index_or_alias","resource.id":"v4_2021-02-03","index":"v4_2021-02-03"}],"type":"index_not_found_exception","reason":"no such index","resource.type":"index_or_alias","resource.id":"v4_2021-02-03","index":"v4_2021-02-03"},"status":404}
      ..........................................................
      {"error":{"root_cause":[{"type":"index_not_found_exception","reason":"no such index","resource.type":"index_or_alias","resource.id":"v4_2021-01-28","index":"v4_2021-01-28"}],"type":"index_not_found_exception","reason":"no such index","resource.type":"index_or_alias","resource.id":"v4_2021-01-28","index":"v4_2021-01-28"},"status":404}{"acknowledged":true}{"error":{"root_cause":[{"type":"index_not_found_exception","reason":"no such index","resource.type":"index_or_alias","resource.id":"v2_searchentities","index":"v2_searchentities"}],"type":"index_not_found_exception","reason":"no such index","resource.type":"index_or_alias","resource.id":"v2_searchentities","index":"v2_searchentities"},"status":404}{"error":{"root_cause":[{"type":"index_not_found_exception","reason":"no such index","resource.type":"index_or_alias","resource.id":"v2_searchentities","index":"v2_searchentities"}],"type":"index_not_found_exception","reason":"no such index","resource.type":"index_or_alias","resource.id":"v2_searchentities","index":"v2_searchentities"},"status":404}{"error":{"root_cause":[{"type":"index_not_found_exception","reason":"no such index","resource.type":"index_or_alias","resource.id":"v2_searchentities","index":"v2_searchentities"}],"type":"index_not_found_exception","reason":"no such index","resource.type":"index_or_alias","resource.id":"v2_searchentities","index":"v2_searchentities"},"status":404}{"error":{"root_cause":[{"type":"index_not_found_exception","reason":"no such index","resource.type":"index_or_alias","resource.id":"v2_searchentities","index":"v2_searchentities"}],"type":"index_not_found_exception","reason":"no such index","resource.type":"index_or_alias","resource.id":"v2_searchentities","index":"v2_searchentities"},"status":404}{"error":{"root_cause":[{"type":"index_not_found_exception","reason":"no such index","resource.type":"index_or_alias","resource.id":"v2_searchentities","index":"v2_searchentities"}],"type":"index_not_found_exception","reason":"no such index","resource.type":"index_or_alias","resource.id":"v2_searchentities","index":"v2_searchentities"},"status":404}{"acknowledged":true}{"error":{"root_cause":[{"type":"index_not_found_exception","reason":"no such index","resource.type":"index_or_alias","resource.id":"v4_2021-02-06","index":"v4_2021-02-06"}],"type":"index_not_found_exception","reason":"no such index","resource.type":"index_or_alias","resource.id":"v4_2021-02-06","index":"v4_2021-02-06"},"status":404}{"error":{"root_cause":[{"type":"index_not_found_exception","reason":"no such index","resource.type":"index_or_alias","resource.id":"v4_2021-02-06","index":"v4_2021-02-06"}],"type":"index_not_found_exception","reason":"no such index","resource.type":"index_or_alias","resource.id":"v4_2021-02-06","index":"v4_2021-02-06"},"status":404}{"error":{"root_cause":[{"type":"index_not_found_exception","reason":"no such index","resource.type":"index_or_alias","resource.id":"v4_2021-02-06","index":"v4_2021-02-06"}],"type":"index_not_found_exception","reason":"no such index","resource.type":"index_or_alias","resource.id":"v4_2021-02-06","index":"v4_2021-02-06"},"status":404}{"error":{"root_cause":[{"type":"index_not_found_exception","reason":"no such index","resource.type":"index_or_alias","resource.id":"v4_2021-02-04","index":"v4_2021-02-04"}],"type":"index_not_found_exception","reason":"no such index","resource.type":"index_or_alias","resource.id":"v4_2021-02-04","index":"v4_2021-02-04"},"status":404}{"error":{"root_cause":[{"type":"index_not_found_exception","reason":"no such index","resource.type":"index_or_alias","resource.id":"v4_2021-02-04","index":"v4_2021-02-04"}],"type":"index_not_found_exception","reason":"no such index","resource.type":"index_or_alias","resource.id":"v4_2021-02-04","index":"v4_2021-02-04"},"status":404}
  • Recheck the health to insure it is green and once green ....
    custm-vrsidm1:~ # curl http://localhost:9200/_cluster/health?pretty=true
    {
      "cluster_name" : "horizon",
      "status" : "green",
      "timed_out" : false,
      "number_of_nodes" : 1,
      "number_of_data_nodes" : 1,
      "active_primary_shards" : 0,
      "active_shards" : 0,
      "relocating_shards" : 0,
      "initializing_shards" : 0,
      "unassigned_shards" : 0,
      "delayed_unassigned_shards" : 0,
      "number_of_pending_tasks" : 0,
      "number_of_in_flight_fetch" : 0,
      "task_max_waiting_in_queue_millis" : 0,
      "active_shards_percent_as_number" : 100.0
    }
  • ... then check the elastic search if it is working or not.

  • After the reboots of the all nodes. Number_of_nodes and number_of_data_nodes is now three (in my case) as should be .....
    custm-vrsidm1:~ # curl http://localhost:9200/_cluster/health?pretty=true
    {
      "cluster_name" : "horizon",
      "status" : "green",
      "timed_out" : false,
      "number_of_nodes" : 3,
      "number_of_data_nodes" : 3,
      "active_primary_shards" : 5,
      "active_shards" : 10,
      "relocating_shards" : 0,
      "initializing_shards" : 0,
      "unassigned_shards" : 0,
      "delayed_unassigned_shards" : 0,
      "number_of_pending_tasks" : 0,
      "number_of_in_flight_fetch" : 0,
      "task_max_waiting_in_queue_millis" : 0,
      "active_shards_percent_as_number" : 100.0
    }
    custm-vrsidm1:~ #
    custm-vrsidm1:~ #  curl -s -XGET http://localhost:9200/_cat/nodes
    10.174.28.19 10.174.28.19 14 97 0.20 d * Orka
    10.174.28.20 10.174.28.20  5 97 0.18 d m Mongoose
    10.174.28.18 10.174.28.18 11 96 0.47 d m Urthona


So, now VIDM seems to be up and running, if we check NSX-T's LB we can see that .....
... the pool is successfully contacting all nodes.
We are also, able to log into .....
... and check graphically that everything is ...
... FINE.

A double check can be done, verifying the file /var/log/boot.msg
<notice -- Feb 16 18:31:28.776900000> 
elasticsearch start

horizon-workspace service is running
Waiting for IDM: ..........
<notice -- Feb 16 18:33:44.203450000> checkproc: /opt/likewise/sbin/lwsmd 1419
<notice -- Feb 16 18:33:44.530367000> 
checkproc: /opt/likewise/sbin/lwsmd 
1419

... Ok.
Number of nodes in cluster is : 3
Configuring /opt/vmware/elasticsearch/config/elasticsearch.yml file
Starting elasticsearch: done.
    elasticsearch logs: /opt/vmware/elasticsearch/logs
    elasticsearch data: /db/elasticsearch
<notice -- Feb 16 18:34:39.403558000> 
'elasticsearch start' exits with status 0


That's it.

mercoledì 10 febbraio 2021

How to easily install VCSA from MacOS

Issue
Today I needed to install the new vCenter server 7.0u1. I downloaded the .iso (VMware-VCSA-all-7.0.1-17327517.iso) file from VMware, double click on the file, then I navigated inside and clicked the file Installer, present under the folder vcsa-ui-installer/mac/.

After that I faced the gatekeeper of the mac (Bug Sur 11.2). In order to proceed with the installation of it had to allow each step. Until, even if I was allowing it to continue, I was no longer able to proceed and the installation was stuck in here....

Solution
Googling around I found how to disable macOS gatekeeper only for a specific folder. I also found an article from William Lam on "How to exclude VCSA UI/CLI Installer from MacOS Catalina Security Gatekeeper"

However, for the installation I proceeded as follows ..
  • I created a new folder namde VCSA (in my case).

  • I copied/extracted all the files into the new VCSA folder ..


  • Opened a new MacOS Terminal

  • Moved into the proper folder, launch the command xattr as shown below in order to remove the metadata "com.apple.quarantine" for the extracted VCSA ISO files

    lorenzo@MacBook-Pro Downloads % sudo xattr -r -d com.apple.quarantine VCSA
  • After the quarantine attribute has been removed, it is possible to run the VCSA UI Installer without being prompted with an error.

  • However it could happen that the installation path is not correctly detected (as in the image below).

    Click on Browser and select the folder VCSA (in my case) the ones with the quarantine metadata removed.

  • It is now possible, to continue with the installation and proceed over ...

    ....until the end.

That's it.

martedì 26 gennaio 2021

NSX-T 3.0 - While deleting Logical Segment, it got stuck in “Deletion in Progress” state and grayed out from UI.

Issue
Today, I have been called by a customer to solve a rather unusual problem. The process of deleting a Logical Segment on an NSX-T 3.0 infrastructure it got stucked in "Deletion in Progress" state for days and grayed out from UI without therefore to have the possibility to take any kind of action.


I tried to look for further information regarding the LS stuck

I tried to verify if by editing, in some way it was possible to undertake and/or force cancellation operations ...

I switched to Manager mode to have a different point of view ....
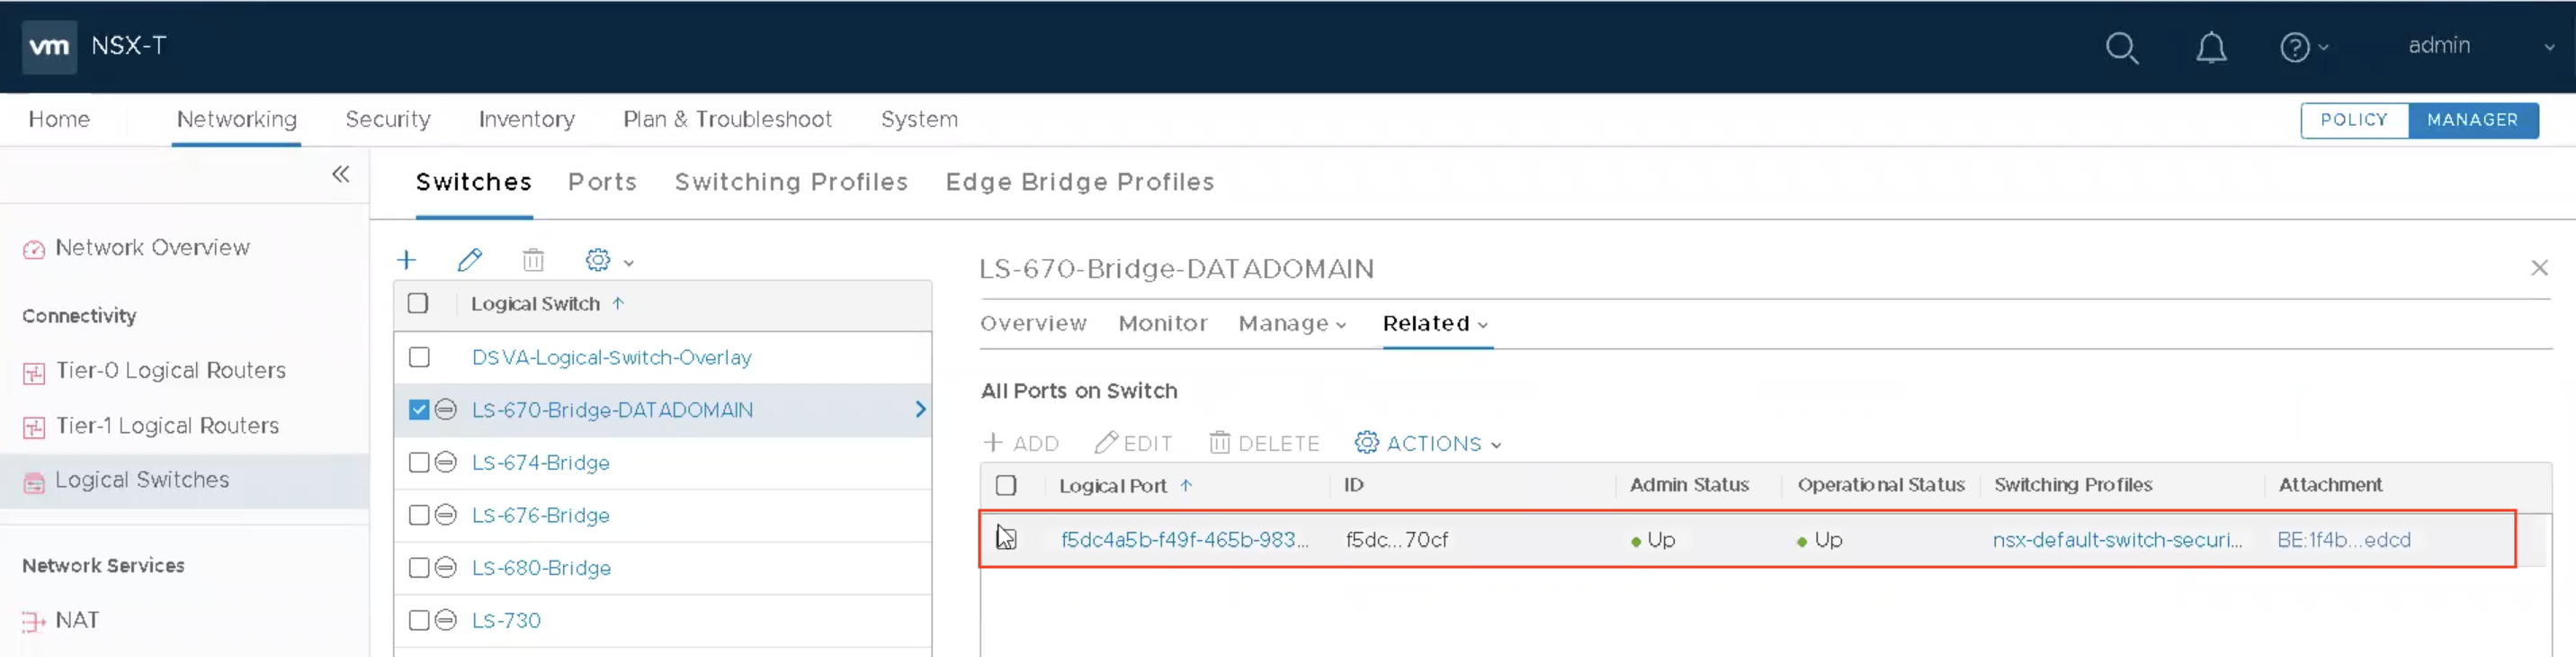
I noticed that there was a "Logical Port" that could block the deletion process ...

open, I tried to delete it, but here too the DELETE botton was grayed out ...

Then I decided to deep investigate inside the NSX-T Manager console in the following way as detailed below....


Disclaimer: Procedures described below may not be officially supported by VMware. Use it at your own risk. Before to perform any action described be sure that you have a valid backup. The best way is to open a Service Request to the support.


Solution
First of all I logged in via SSH to NSX-T Manager with the admin user and then raised the permissions to the root user level.

I moved into the directory "/var/log/policy" ...
root@NSXM-01:~# cd /var/log/policy/ 
Checked the policy.log log file for information about the switch to delete. In my case (verifying the dates) the information I was looking for were present in the .1.log.gz file ...
root@NSXM-01:/var/log/policy# zcat policy.1.log.gz | grep -i <LS NAME> 

I therefore wanted to check the realized state. When you make a configuration change, NSX Manager typically sends a request to another component to implement the change. For some entities, if you make the configuration change using the API, you can track the status of the request to see if the change is successfully implemented.

The configuration change that you initiate is called the desired state. The result of implementing the change is called the realized state. If NSX Manager implements the change successfully, the realized state will be the same as the desired state. If there is an error, the realized state will not be the same as the desired state.

Below the command executed to check the Logical Segment in stuck and the output ...
root@NSXM-01:/var/log/policy# curl -k -u admin -X GET "https://localhost/policy/api/v1/infra/realized-state/realized-entities?intent_path=/infra/segments/LS-670-Bridge-DATADOMAIN"
Enter host password for user 'admin':
{
  "results" : [ {
    "extended_attributes" : [ {
      "data_type" : "STRING",
      "multivalue" : false,
      "values" : [ "/infra/tier-1s/T1-Gateway" ],
      "key" : "connectivity_path"
    }, {
      "data_type" : "STRING",
      "multivalue" : true,
      "key" : "l2vpn_paths"
    } ],
    "entity_type" : "RealizedLogicalSwitch",
    "intent_paths" : [ "/infra/segments/LS-670-Bridge-DATADOMAIN" ],
    "resource_type" : "GenericPolicyRealizedResource",
    "id" : "infra-LS-670-Bridge-DATADOMAIN-ls",
    "display_name" : "infra-LS-670-Bridge-DATADOMAIN-ls",
    "path" : "/infra/realized-state/enforcement-points/default/logical-switches/infra-LS-670-Bridge-DATADOMAIN-ls",
    "relative_path" : "infra-LS-670-Bridge-DATADOMAIN-ls",
    "parent_path" : "/infra/realized-state/enforcement-points/default",
    "unique_id" : "13fd4bf5-f067-4806-9317-93013928b0d0",
    "intent_reference" : [ "/infra/segments/LS-670-Bridge-DATADOMAIN" ],
    "realization_specific_identifier" : "11104acc-5aac-4e50-8689-c31492d455f4",
    "realization_api" : "/api/v1/logical-switches/11104acc-5aac-4e50-8689-c31492d455f4",
    "state" : "ERROR",
    "alarms" : [ {
      "message" : "Unable to delete logical port with attachments of LogicalPort LogicalPort/f5dc4a5b-f49f-465b-9832-86151b3670cf.",
      "source_reference" : "/infra/realized-state/enforcement-points/default/logical-switches/infra-LS-670-Bridge-DATADOMAIN-ls",
      "error_details" : {
        "error_code" : 8402,
        "module_name" : "NsxSwitching service",
        "error_message" : "Unable to delete logical port with attachments of LogicalPort LogicalPort/f5dc4a5b-f49f-465b-9832-86151b3670cf."
      },
      "resource_type" : "PolicyAlarmResource",
      "id" : "REST_API_FAILED",
      "display_name" : "a2759a0c-0c98-4e6b-abd0-c58ea326c5be",
      "relative_path" : "a2759a0c-0c98-4e6b-abd0-c58ea326c5be",
      "unique_id" : "fe05784c-3f69-4ca8-9a01-9df9e3750e8b",
      "_system_owned" : false,
      "_create_user" : "system",
      "_create_time" : 1611589503519,
      "_last_modified_user" : "system",
      "_last_modified_time" : 1611589503521,
      "_protection" : "NOT_PROTECTED",
      "_revision" : 0
    } ],
    "runtime_status" : "UNINITIALIZED",
    "_system_owned" : false,
    "_create_user" : "system",
    "_create_time" : 1610550767404,
    "_last_modified_user" : "system",
    "_last_modified_time" : 1611229785697,
    "_protection" : "NOT_PROTECTED",
    "_revision" : 42
  } ],
  "result_count" : 1
}
root@NSXM-01:/var/log/policy#
From the previous output it is evident that the Segment is in an ERROR state, because it is blocked by the logical ports which are still being attacked .....

"message" : "Unable to delete logical port with attachments of LogicalPort LogicalPort/f5dc4a5b-f49f-465b-9832-86151b3670cf."

Next step, is to attempt to delete the STALE Logical Port via UI. Owever, as we realized before is not possible to delete Logical Port via UI. The second option is to delete the logical port via API which fails too if you use vanilla Logical Port DELETE operation.
Before to delete it, I retrieve information about the Segment and perform NSX-T backup... in case they will be needed later....
root@NSXM-01:/var/log/policy# curl -k -u admin -X GET "https://localhost/api/v1/logical-ports/f5dc4a5b-f49f-465b-9832-86151b3670cf"
Enter host password for user 'admin':
{
  "logical_switch_id" : "11104acc-5aac-4e50-8689-c31492d455f4",
  "attachment" : {
    "attachment_type" : "BRIDGEENDPOINT",
    "id" : "1f4bd81c-83c6-43be-b690-a9aac5a6edcd"
  },
  "admin_state" : "UP",
  "address_bindings" : [ ],
  "switching_profile_ids" : [ {
    "key" : "SwitchSecuritySwitchingProfile",
    "value" : "47ffda0e-035f-4900-83e4-0a2086813ede"
  }, {
    "key" : "SpoofGuardSwitchingProfile",
    "value" : "fad98876-d7ff-11e4-b9d6-1681e6b88ec1"
  }, {
    "key" : "IpDiscoverySwitchingProfile",
    "value" : "64814784-7896-3901-9741-badeff705639"
  }, {
    "key" : "MacManagementSwitchingProfile",
    "value" : "1e7101c8-cfef-415a-9c8c-ce3d8dd078fb"
  }, {
    "key" : "PortMirroringSwitchingProfile",
    "value" : "93b4b7e8-f116-415d-a50c-3364611b5d09"
  }, {
    "key" : "QosSwitchingProfile",
    "value" : "f313290b-eba8-4262-bd93-fab5026e9495"
  } ],
  "ignore_address_bindings" : [ ],
  "internal_id" : "f5dc4a5b-f49f-465b-9832-86151b3670cf",
  "resource_type" : "LogicalPort",
  "id" : "f5dc4a5b-f49f-465b-9832-86151b3670cf",
  "display_name" : "f5dc4a5b-f49f-465b-9832-86151b3670cf",
  "_system_owned" : false,
  "_create_user" : "admin",
  "_create_time" : 1610731219571,
  "_last_modified_user" : "admin",
  "_last_modified_time" : 1610731219571,
  "_protection" : "NOT_PROTECTED",
  "_revision" : 0
}
root@NSXM-01:/var/log/policy#
We are now ready to perform forceful deletion of the Logical Port inside NSX-T database, in the following way ...
root@NSXM-01:/var/log/policy# curl -k -u admin -H "Accept:application/json" -H "Content-Type:application/json"  -X DELETE "https://localhost/api/v1/logical-ports/f5dc4a5b-f49f-465b-9832-86151b3670cf?detach=true"

Removed the blocking object, in our case the Logical Port, the deletion process of the Logical Segment was successfully completed by removing the Segment itself.
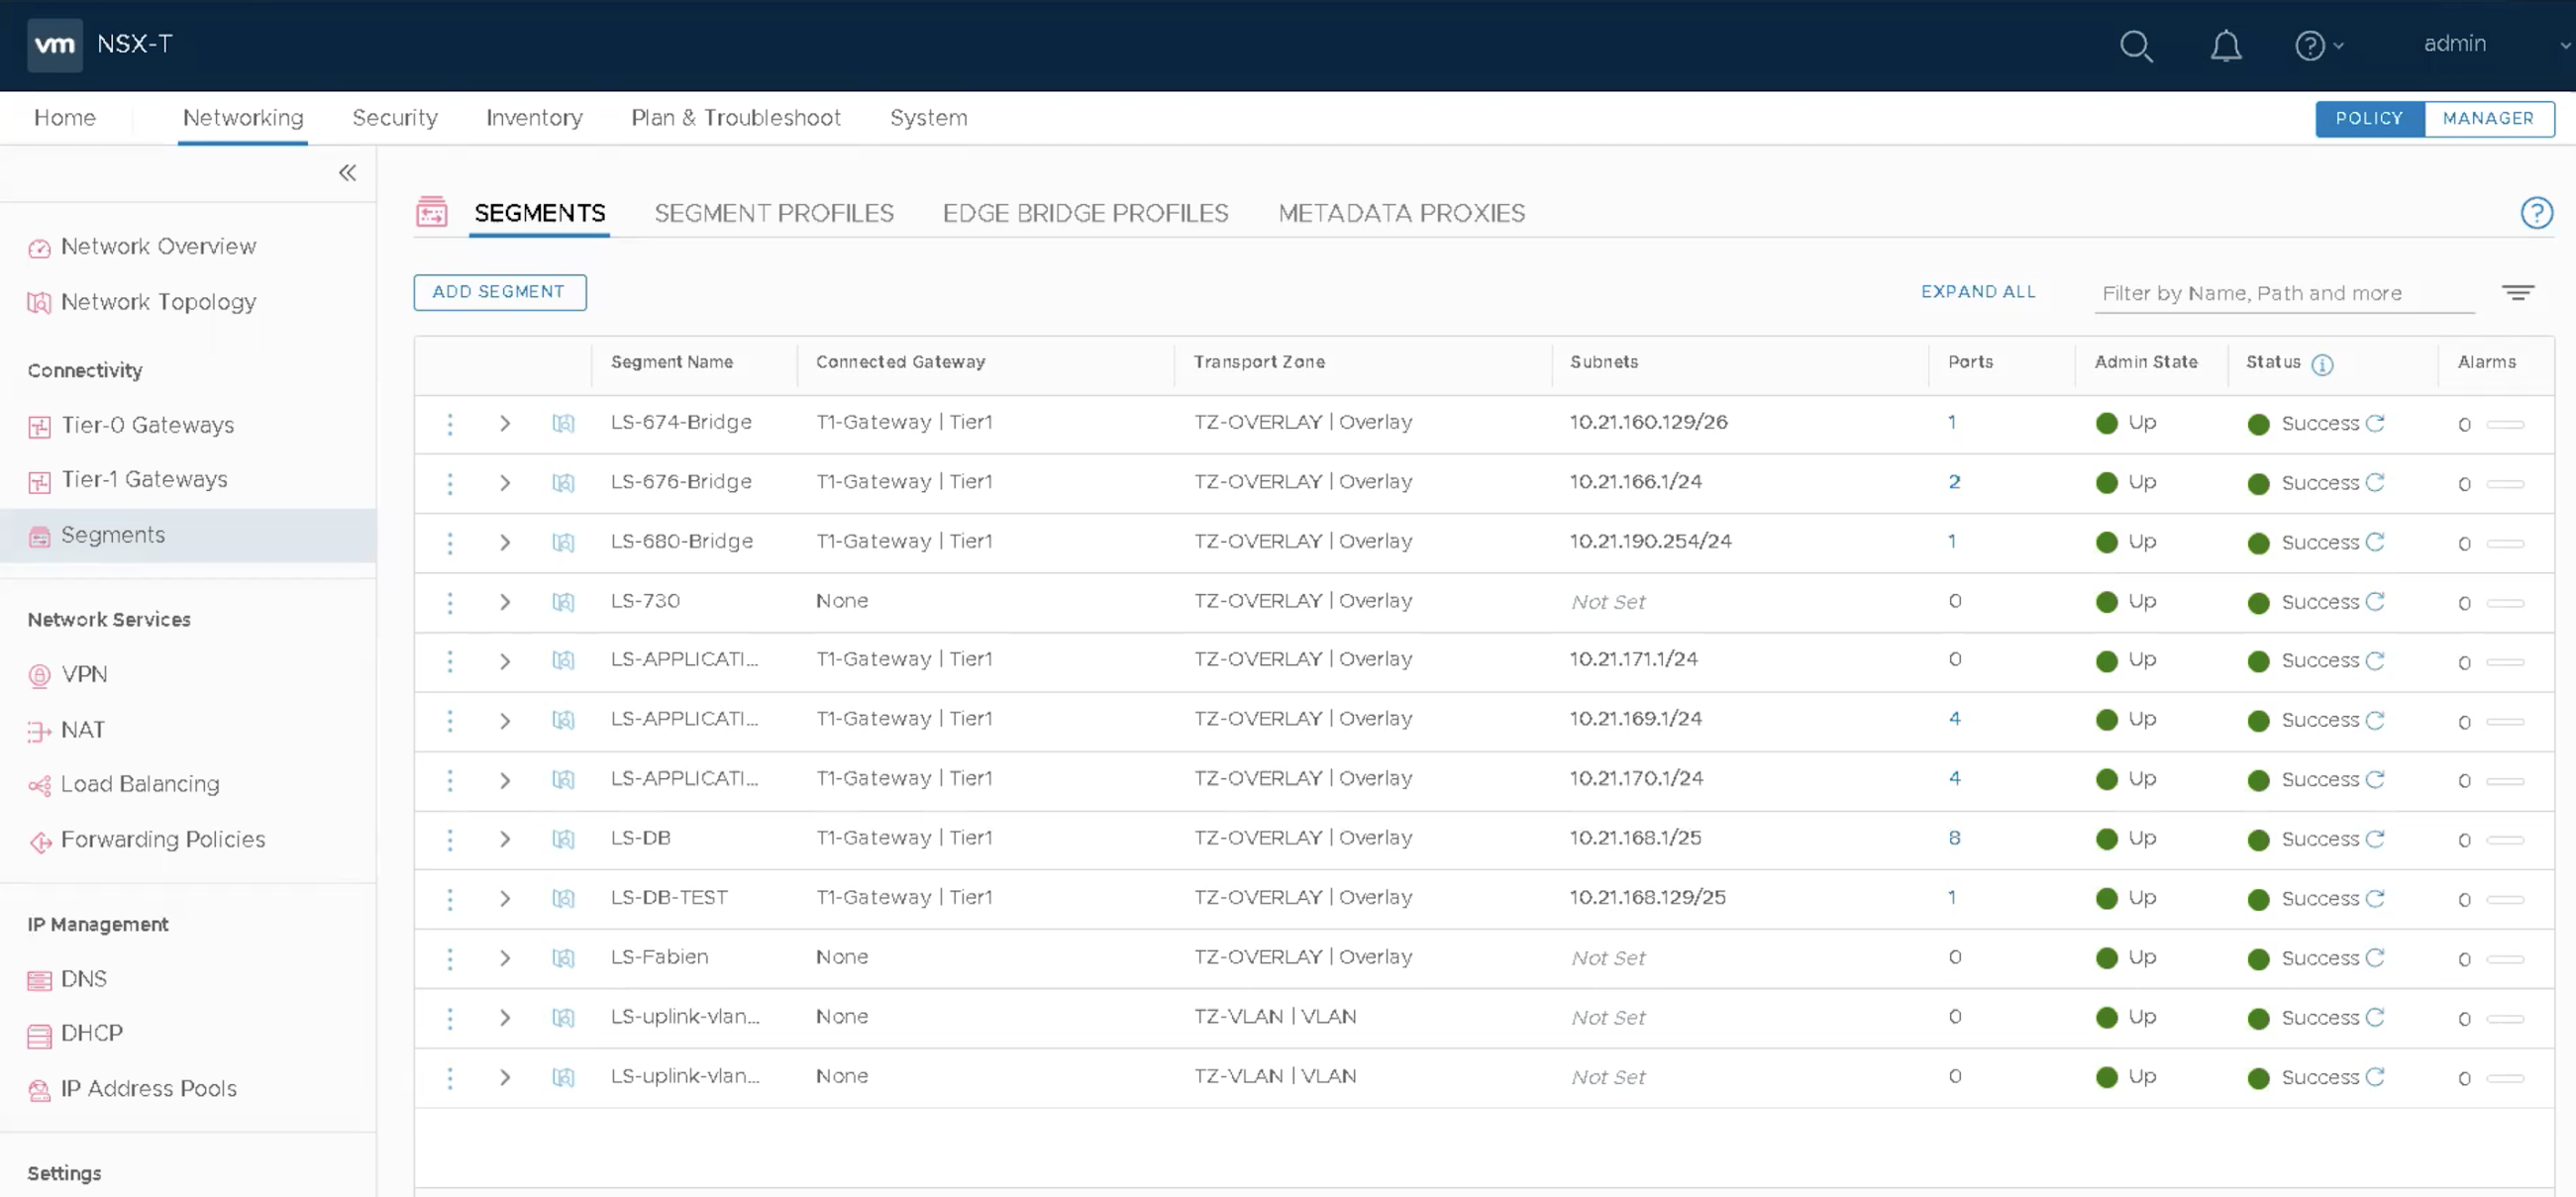
It takes a few moments for the deletion process to be completed ... after that, checking into Networking > Segments, the Logical Segment has gone.

That's it.

venerdì 8 gennaio 2021

VMware NSX for vSphere 6.4.7 not more available to download

Issue
Today I found out, by performing a compatibility check between the various versions of ESXi and NSX to upgrade a customer's farm, that NSX 6.4.7 version due to a serious bug has been removed from download in favor of 6.4.8 (release notes).

" What's New in NSX Data Center for vSphere 6.4.8
VMware NSX for vSphere 6.4.8 resolves a specific issue identified in VMware NSX for vSphere 6.4.7, which could affect both new NSX customers as well as customers upgrading from previous versions of NSX. See Resolved Issues for more information. ”


As you can see from the images below, version 6.4.7 is no longer present from the download ....


... and from the interoperability matrix tables as well.


Solution
It is a good idea to upgrade VMware NSX Data Center for vsphere to version 6.4.8 at least.

That's it.

mercoledì 22 luglio 2020

Change VMNIC name to fit NSX-T Transport Node Profile

Issue
During the design phase of an NSX-T Datacenter implementation, there are a lot of Design Desicions to be addressed and taken, such as the size of the appliances, how many TZ to create, how many Edges (sizing, Active/Active, Active/Standby) .... and so on.

In this design decision I found myself having to consider the following:

  • The customer have many ESXi host clusters to configure with NSX-T where the vmnics that should be used for the creation of the N-VDS are not homogeneous (at the naming convention level). This means, for example, that in a Host-A the vmnic to be used could be named vmnic4 while in a Host-B the vmnic to be associated to the N-VDS could be vmnic9 and so on for other hosts.

  • Second consideration, we are operating in a brown-field environment, where VMs are already up and running.


Well, not having homogeneous vmnic and given the objective need to create a single Transport Node Profile (also applicable to multiple clusters) it was decided to rename the vmnic that will be used/associated with the specific N-VDS in vmnic100 (as showed from the below picture).


As implication for sure we will have to configure each ESXi hosts of the cluster, putting it in maintenance mode (so it to evacuate all running VMs away), rename the vmnic o the vmnics and then restart the system.

Solution
In order to rename/renumbering the vmnics, I found a link to KB article 2091560 that describe how to do this with vSphere 6.x!

So, in our case we want to change the aliases assigned by the ESXi host, for example from vmnic4 to vmnic100, not using Host Profiles but by command line.

Onces gotten the SSH access to the ESXi, from the shell, run the command to see the current assignment of aliases to device locations:

localcli --plugin-dir /usr/lib/vmware/esxcli/int/ deviceInternal alias list
Output


When a nic is controlled by a native driver, then there are actually two aliases associated with the device: a pci alias for the pci device and a logical alias for the uplink logical device.
For each alias that you want to reassign, use the command:

localcli --plugin-dir /usr/lib/vmware/esxcli/int/ deviceInternal alias store --bus-type pci --alias vmnicN --bus-address B

When the logical alias is present, then both the pci alias and logical alias need to be renamed:

localcli --plugin-dir /usr/lib/vmware/esxcli/int/ deviceInternal alias store --bus-type logical --alias vmnicN --bus-address B

where the vmnicN and B are the new assignment that you want to make. For instance, in my case the command is ...

localcli --plugin-dir /usr/lib/vmware/esxcli/int/ deviceInternal alias store --bus-type pci --alias vmnic100 --bus-address s00000002.00


In order the changes take effect it is necessary to perform a clean shut down and reboot the system.

That's it.

lunedì 20 luglio 2020

NIC network Stats

Issue
Today I face out a singular issue, concerning networks micro disconnection and the needs verify information on the physical NICs regarding packet drops and so on ..

Solution
To do that, I wrote a powershell script, available below.
It is enough just replace the variables<VCENTER_FQDN_or_IP> with it's own vCenter (FQDN or IP) references and <CLUSTER_NAME> with the name of the Cluster where the ESXi Hosts are placed.
Connect-VIServer -Server <VCENTER_FQDN_or_IP> 

$hosts = Get-Cluster <CLUSTER_NAME> |Get-VMHost
$Report = @()
foreach($ESXi in $hosts){
  $esxcli = get-vmhost $ESXi | Get-EsxCli
  $nics = $esxcli.network.nic.list.Invoke()
  foreach($pNic in $nics){
               $tempModule=@{}
               $tempModule.Name = $ESXi.name
               $tempModule.NIC_Name =  $pNic.Name
                $tempModule.NIC_Link =  $pNic.Link
                $tempModule.NIC_LinkStatus =  $pNic.LinkStatus
                $tempModule.NIC_Driver =  $pNic.Driver
                $tempModule.NIC_Duplex =  $pNic.Duplex
                $tempModule.NIC_MACAddress =  $pNic.MACAddress
                $tempModule.NIC_MTU =  $pNic.MTU
                $tempModule.NIC_Speed =  $pNic.Speed
 
                $vmnicstats = $esxcli.network.nic.stats.get($pNIC.Name)
                $tempModule.vmnic_Broadcastpacketsreceived =  $vmnicstats.Broadcastpacketsreceived
                $tempModule.vmnic_Broadcastpacketssent =  $vmnicstats.Broadcastpacketssent
                $tempModule.vmnic_Bytesreceived =  $vmnicstats.Bytesreceived
                $tempModule.vmnic_Bytessent =  $vmnicstats.Bytessent
                $tempModule.vmnic_Multicastpacketsreceived =  $vmnicstats.Multicastpacketsreceived
                $tempModule.vmnic_Multicastpacketssent =  $vmnicstats.Multicastpacketssent
                $tempModule.vmnic_Packetsreceived =  $vmnicstats.Packetsreceived
                $tempModule.vmnic_Packetssent =  $vmnicstats.Packetssent
                $tempModule.vmnic_ReceiveCRCerrors =  $vmnicstats.ReceiveCRCerrors
                $tempModule.vmnic_ReceiveFIFOerrors =  $vmnicstats.ReceiveFIFOerrors
                $tempModule.vmnic_Receiveframeerrors =  $vmnicstats.Receiveframeerrors
                $tempModule.vmnic_Receivelengtherrors =  $vmnicstats.Receivelengtherrors
                $tempModule.vmnic_Receivedmissederrors =  $vmnicstats.Receivedmissederrors
                $tempModule.vmnic_Receiveovererrors =  $vmnicstats.Receiveovererrors
                $tempModule.vmnic_Receivepacketsdropped =  $vmnicstats.Receivepacketsdropped
                $tempModule.vmnic_Totalreceiveerrors =  $vmnicstats.Totalreceiveerrors
                $tempModule.vmnic_Totaltransmiterrors =  $vmnicstats.Totaltransmiterrors
                $tempModule.vmnic_TransmitFIFOerrors =  $vmnicstats.TransmitFIFOerrors
                $tempModule.vmnic_Transmitabortederrors =  $vmnicstats.Transmitabortederrors
                $tempModule.vmnic_Transmitcarriererrors =  $vmnicstats.Transmitcarriererrors
                $tempModule.vmnic_Transmitheartbeaterrors =  $vmnicstats.Transmitheartbeaterrors
                $tempModule.vmnic_Transmitpacketsdropped =  $vmnicstats.Transmitpacketsdropped
                $tempModule.vmnic_Transmitwindowerrors =  $vmnicstats.Transmitwindowerrors
               
                $temp = New-Object -TypeName PSObject -Property $tempModule
               $Report += $temp
  }
}
$Report | Select * | Sort-Object -Property Name | Out-Gridview


That's it.